

The ONSet of Doom?

When it comes to data analysis I’d be the first to admit I’m a bit of a neophyte. Squiggly stuff like equations - love it. Real numbers - a bit yukky.
But I occasionally get the urge to confuse myself and play with hard ‘data’, particularly when it comes to covid.
Accordingly, I thought I’d have another play with the data I’ve downloaded from the UK’s Office of National Statistics (the ONS).
The data I looked at is the all-cause deaths, by date of registration, for England & Wales for the years 2015 - 2021.
I wanted to ‘simplify’ things a bit, or at least find a way that ought to have simplified things a bit (for me), so I decided to split the data into 4-week chunks. My reasoning here was that I am a bit leery of comparing week x of one year with the same week in another year. I thought that comparing 4-week chunks would help smooth out any weird offsets that might occur from year to year.
I decided to ‘simplify’ things a bit further and instead of using a total for each 4-week chunk I decided to use an average for the chunk so that each 4-week chunk would be represented by the average deaths per week (just the simple total for the 4 weeks divided by 4).
Here’s the data for 2015 to 2019 (a five year period) for the over 45’s. Data point 14 corresponds to the first 4-week chunk of 2016, for example.
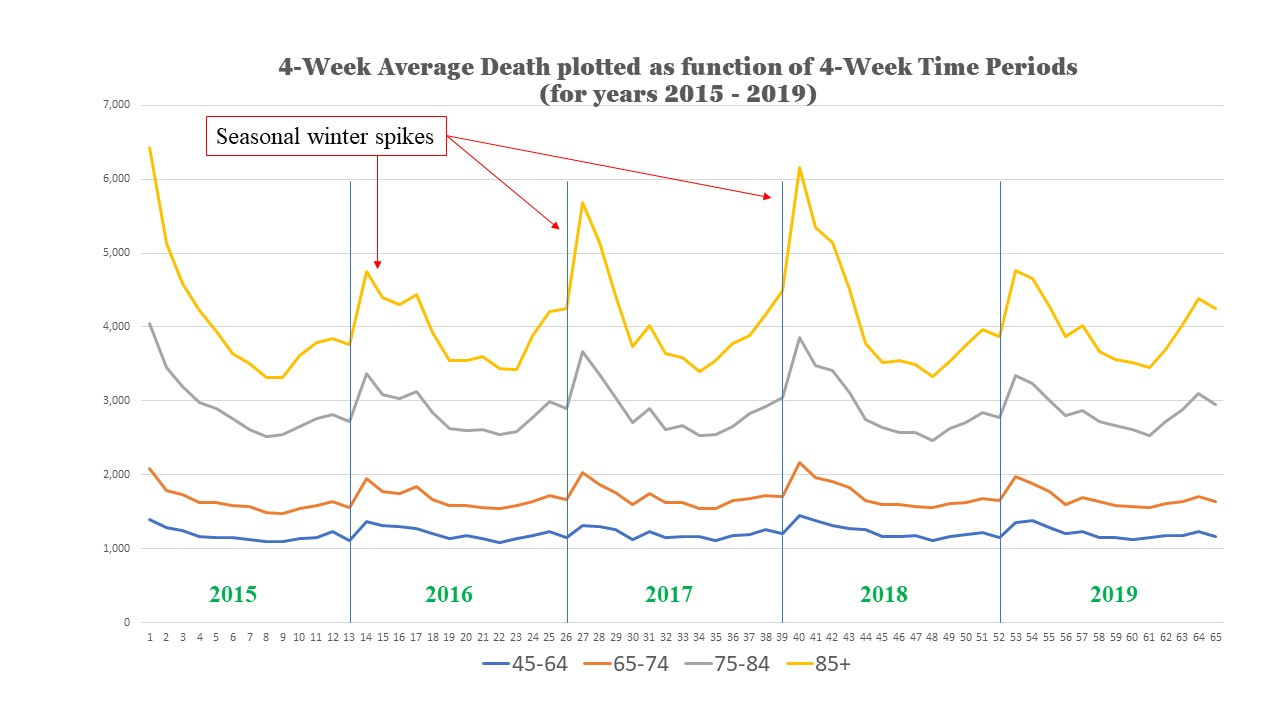
When a year has 53 weeks (like 2015 and 2020) I took the last 5 weeks as a ‘chunk’. There will still be a potential offset issue here, but it shouldn’t be too significant.
You’ll notice a kind of ‘kink’ in the data at the end of a year. This is due to the time lag in death registration during the holiday season.
The 2015 - 2019 ONS data only breaks things down into the age ranges
< 1 year
1 - 14
15 - 44
45 - 64
65 - 74
75 - 84
85 +
So I'm stuck with these ranges with the data I have.
It all looks quite reasonable. In the first chunk of 2017, for example, we see that there were a bit more than 5,500 deaths per week (on average) in the over 85’s.
I decided to create a ‘baseline’ by taking the 4 year average of 2016 -2019 (excluding 2015 removes one year with 53 weeks) and this is the result. So it’s the average weekly death in the over 15’s averaged over a 4-year time period.
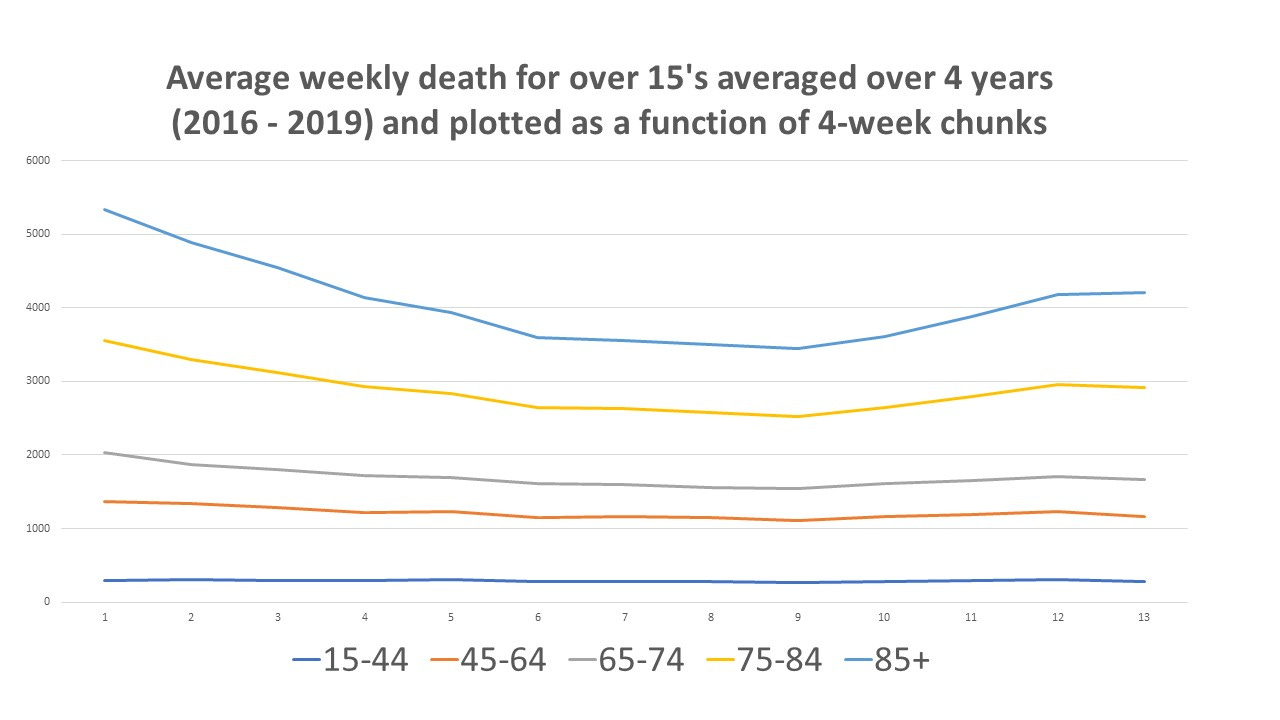
There’s nothing much to remark on here. As expected, we see greater seasonal variation as we go up through the age ranges.
Happy that I’d got everything in reasonable shape, I then looked at the data for 2020 and 2021.
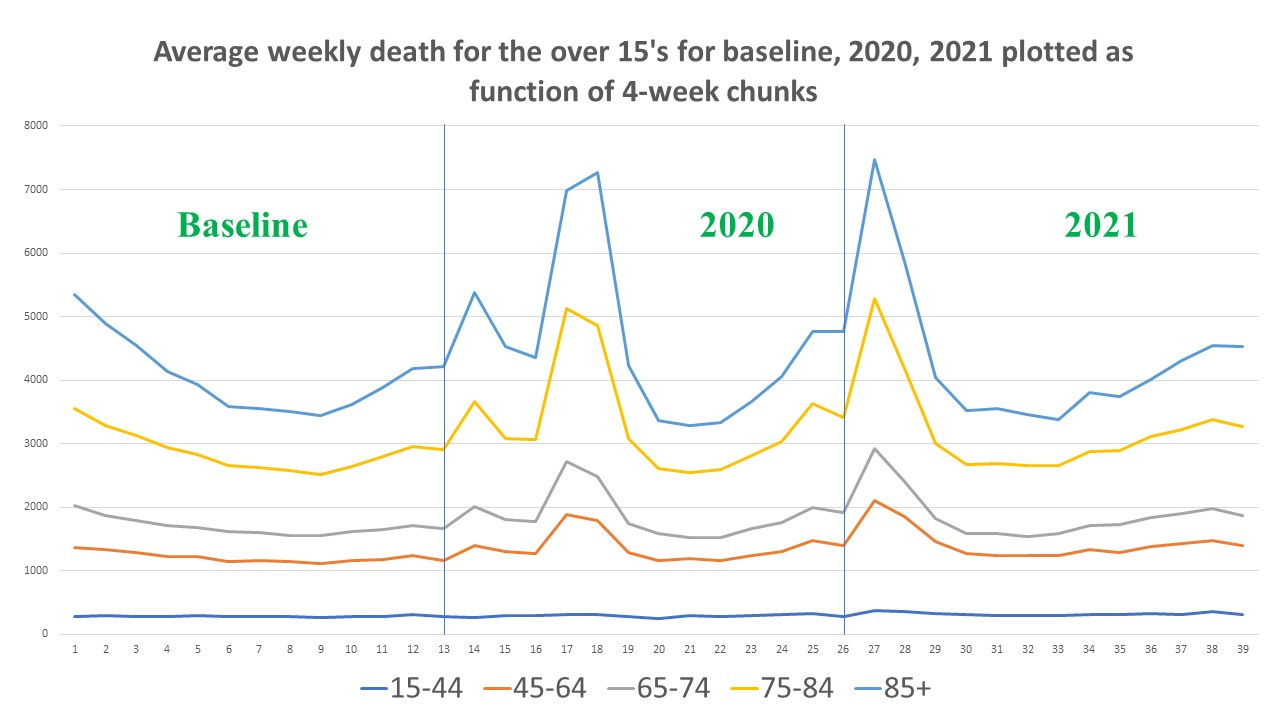
We can see the clear spikes here caused by the initial covid outbreak and the “2nd wave”. It’s likely that a reasonable portion of these deaths were due to medical mismanagement (ventilators, midazolam, etc) - but a death is a death and, whatever the cause, there are 2 significant spikes in the data.
It also seems clear, at least from this chart, that as far as the under 45’s were concerned, not much out of the ordinary was happening. But is this true?
In order to figure out what is “out of the ordinary” we have to have some idea of what “ordinary” means. The 2016 - 2019 baseline curve gives us an idea of what this “ordinary” is. It’s not a perfect measure, by any means, but it’s also not crazy, or wildly inaccurate.
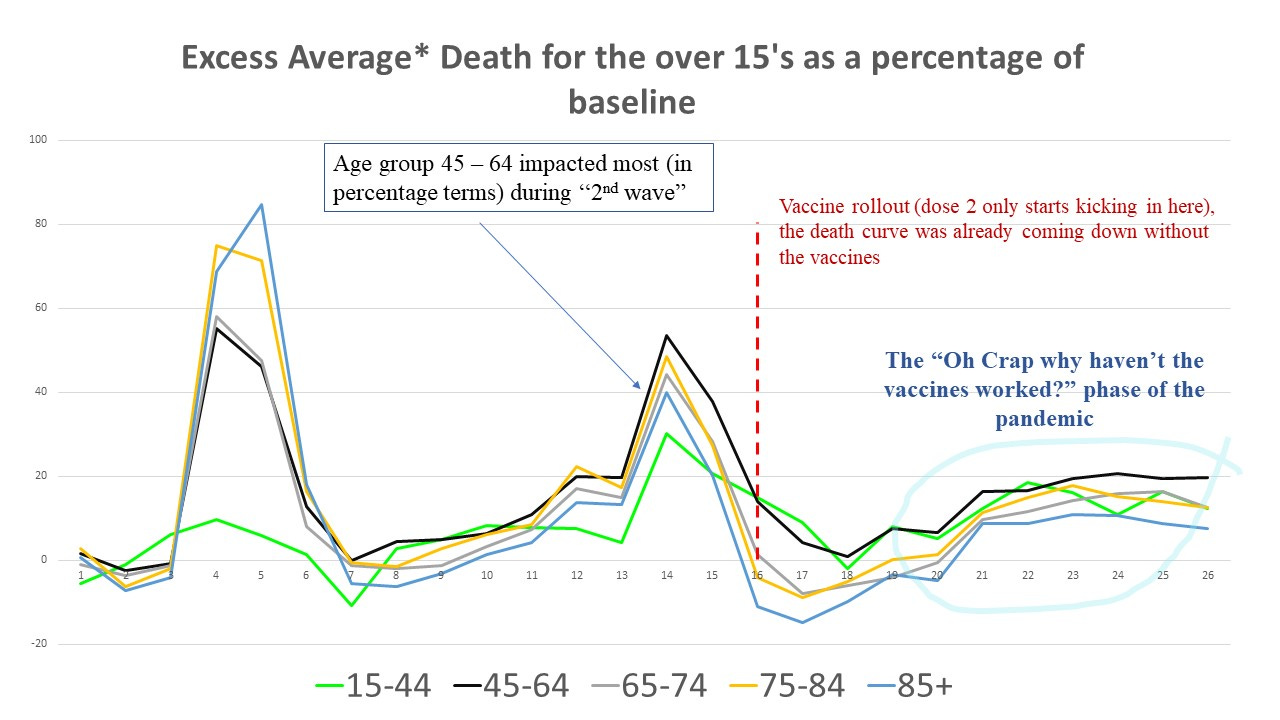
We also need to know how far out of the ordinary things are. In order to do that we need to look at percentages. So in the next chart the excess (out of ordinary minus ordinary) is plotted as a percentage of the ordinary1.
There’s a fair bit to unpack in this chart, so let’s do so.
The excess average here is calculated by taking the 4-week chunk average and subtracting the 4-week chunk average of the baseline. This is then re-written as a percentage of the baseline value.
We can see that the age range 15 - 44 was impacted by the ‘waves’ with excess death percentage reaching about 30% above baseline in the 2nd wave. Clearly, something a bit “out of the ordinary” was happening in this demographic.
The 2nd wave recedes before the vaccine could possibly have had any really significant impact.
By chunk 17 (week 19 of 2021) 2nd dose vaccine coverage was over 90% in the over 75’s. Curiously, we see that the excess death percentage in these demographics begins to rise again at this point.
Instead of going back to normal (i.e. the baseline) excess death percentage has remained elevated in the last half of the year across all demographics in this chart. This is not due to covid2, but something else.
This persistent excess is worse in the under 85’s and is evident even in the 15 - 44 demographic. This is a demographic we would not normally expect (on average) to be ill3.
We would expect that, after the rollout of a safe vaccine, things would get back to normal (all other things being equal).
The portions of negative excess (around chunk 16) in the over 65’s can be explained by the fact that the 2nd wave dispatched the weak and infirm in these demographics.
Whether we cling to the faint hope that the vaccines actually did anything (and were safe) or we think that the vaccines caused the persistent excess death, the point here is that we fucked up. Things did not go back to normal. There is nothing but abject failure to be seen in this data.
My interpretation, based on the fact the younger demographics were also significantly impacted, is that the Clotshot of Catastrophe has been largely responsible for this persistent elevation of excess death in the latter half of 2021 across all demographics.
I haven’t tried looking for the 2022 ONS data yet. My understanding is that there are one or two issues with it - but I don’t know whether these have been ironed out, or whether the data is complete yet.
But the 2021 data is clear enough - even at this simple level of analysis.
For the less mathematically inclined, think of it this way. An increase of £1 on an item that costs £5 is worse than a £1 increase on an item that costs £20. The increase, the ‘excess’, is a greater percentage of the original price for the first item.
If one were to still cling to the fantasy that it was covid, then one would have to admit that the vaccines have done bugger all to prevent death based on this data. We could fall back on the old “it would have been worse” style of argumentation, but then one would also have to try to explain why we would expect covid to be as serious for subsequent waves when a very significant fraction of the population have infection-acquired immunity (not to mention the effect of the emergence of a milder variant such as Omicron).
The caveat here is that I’m working with percentages. It wouldn’t take very large (absolute) numbers to raise the excess percentage in this demographic, but the fact the the excess percentage is similar across all demographics makes me suspicious here. It could be that 20% of patients in any demographic were fatally affected by hospital delays etc but I’m doubtful.
Sounds like when we had a 30%-somthing increase in chainsaw-accidents from one year to the next.
It led to chainsaws now requiring a license to operate (there are twelve such licenses, total cost to get all of them is about £3 000) since media gotthe politicos to panic.
That we had had a whopper of a storm the previous year, leading to lots more small forest-owners being out and about working in dangerous circumstances, storm-felled trees being ridiculouslydangerous, didn't register.
And now our forest industry have trouble finding employees. Gee. All numbers approximations:
Driver's license, regular one for manual and auto: £3 500 - £5 000 on average, all costs included.
License for heavy vehicles (18-wheelers): £2 000
License for harvester: £ 2 000
License for chainsaw, basic: £ 1000
I'll stop there, by asking: what 18-yearod would invest that much to the go into forrestry work which is seasonal anyway?
And "the market forces" were initially the driving force behind the licenses, to keep competiton out. Before the EU, you were trained on the job and got sacked if "youse wuz an eedjit".
From this week's ONS figures total deaths down which they seem to boast about:
https://www.ons.gov.uk/peoplepopulationandcommunity/birthsdeathsandmarriages/deaths/bulletins/deathsregisteredweeklyinenglandandwalesprovisional/weekending31march2023
But look at the excess numbers:
"The number of deaths was above the five-year average in private homes (28.7% above, 732 excess deaths), hospitals (20.4% above, 869 excess deaths), care homes (14.8% above, 298 excess deaths) and other settings (14.3% above, 106 excess deaths)."
"The number of deaths registered in the UK in the week ending 31 March 2023 (Week 13) was 13,137, which was 19.6% above the five-year average (2,156 more deaths)"
This statement at the beginning:
"In the week ending 31 March 2023 (Week 13), 11,584 deaths were registered in England and Wales;"
So looks like Scotland and Northern Ireland a higher percentage yet again based on them having between them about 10% of the population.
Considering the Winter 'flu season has gone why are the excess deaths still so persistently high and that is with the new revised upwards 5 year average death numbers which is now "The term excess deaths in this statistical bulletin refers to the number of deaths above the five-year average. For 2020 and 2021, the average for 2015 to 2019 has been used. For 2022, the average is calculated from 2016 to 2019 and 2021 data. For 2023, the average is calculated from 2017 to 2019, 2021, and 2022 data. This provides a comparison of the number of deaths expected in a usual (non-coronavirus pandemic) year.".
Anyone guess at a cause considering almost zero autopsies are being done that include looking for a possible link to the jibbyjabbies or whether they had no part of the death and we are all nutters.