
Vaxxing Lyrical and Making Stuff Up
Vaxxing Lyrical and Making Stuff Up

The Road to Wealth is Paved with Good Injections
The idea of vaccination is great. The original idea was to infect someone with a milder close relative of a disease so that the body’s defences could be stimulated to be more effective for when the real, and much more dangerous, thing came along.
The problem, as it is with lots of great scientific ideas, is in the implementation.
In my field of quantum mechanics there’s this really neat idea that has been termed quantum teleportation. It’s a bit of a misnomer (you need those sexy names to get your slice of the funding pie) but the idea is that you can “instantaneously” recreate the exact quantum state of something at a remote location. It’s not at all instantaneous because in order to achieve this you also have to send along some “classical” information which must trundle along at the pedestrian speed of light, at best.
When I finally get round to writing up a few primers on QM, I might get round to explaining quantum teleportation, but the point I’m trying to make here is that it’s a bit of a nightmare to actually do this in a lab - and even more of a nightmare to achieve this over long distances.
Fantastic idea, but we’re not even close to being able to implement this properly for real (and useful) applications.
Part of the problem with vaccines is that a whole mythology has built up around them; they’re a medical miracle that has saved countless lives, and so on.
When you look a little more closely, you will find that the truth (the implementation) is somewhat more prosaic. Deaths and serious outcomes for many (all?) of the diseases we vaccinate against were dropping like a stone, before vaccination, because of things like better hygiene, nutrition, and medical care.
And things like the smallpox vaccine, the first to be mandated as far as I’m aware, is not quite the unblemished success story we are often led to believe. I think the term conscientious objector first arose in English Law in 1898 to describe those who refused the smallpox vaccine, or refused to get their children vaccinated.
This, of course, doesn’t mean that vaccines are not (potentially) a useful tool in our medical armoury, but that they might not be quite the spectacular lifesavers they are claimed to be in all cases.
If you’re a Pharma Exec, they’re an absolute miracle. Here’s a product you can get almost all of a population to take - and within a few years of birth. Who doesn’t want to protect their children? Won’t anyone think of the money children?
I’ve seen claims that in the US there are over 70 vaccines (including any boosters) on the childhood vaccine schedule. Let’s be conservative and call that number 30. There are about 3.5 million kids born each year in the US. At, say, $20 a shot1, that’s a grand total of 2.1 billion dollars of pretty much guaranteed revenue each year. Nice little earner.
If you can get people crazy scared about some new virus for which you can knock up a ‘vaccine’ in a few short days2, then crack open the Dom Pérignon.
Cynical? Me?
I will always, I think, remain deeply suspicious of any profit motive attached to health. On the one hand people do need to earn a living and companies need returns on their investments, but the other hand seems a bit too much “in the till” in some cases.
We can set up government bodies to make sure the profit motive isn’t getting a bit out of hand with businesses attempting to push useless and expensive products on us, but with covid we’ve seen just how compromised those public bodies are. Those responsible for safeguarding the system seem to get cushy Pharma jobs when they leave their government roles, and what are we to make of the FDA basically acting as Pharma shills by trying to get the covid vax trial data hidden for up to 75 years?
Would Have, Could Have, Should Have
My fevered and feverish mind is now struggling with how to properly segue to where I actually want to get to with this piece - so let’s just bite the bullet, take the shot, and go for that novel spike of surprise.
One of the features of covid has been the use of what might be termed “counterfactual” reasoning. It sounds like this is reasoning that is ‘counter’ to the facts, but that’s not quite right. It’s an attempt to reason about what would have happened.
Team Sane™, for example, argue that we would have been better off if we had simply done nothing for covid. And that’s not what we were (in the main) arguing for anyway - we’re just saying that given 2 options, the actual government response and do nothing, then the “do nothing” response would have been the better option of the 2.
Team BatShitCrazy™, on the other hand, faced with the depressing reality that none of their crap seemed to be working, fell back on the “things would have been so much worse” style of argumentation.
Both forms of argumentation require some aspect of “would have”.
The term would have is, of course, just another way of saying we have some kind of model, at least in principle; we have some thought experiment. There’s nothing wrong with making these kind of arguments and, in fact, they’re kind of essential for the progress of science. The only real difference is whether we apply our model retrospectively (to figure out what would have happened had we done something different) or predictively (to figure what might happen in the future).
I was initially quite supportive of the covid vaccines - although I was highly sceptical that sufficient testing had been performed, despite the various claims made. Turns out my scepticism was completely justified, and thank God I didn’t get stabbed3. Had I stayed at my university I would not have been able to escape the Needle of Doom™, which was a factor in me leaving my job.
The question that has bugged me for a while, and one which I haven’t properly been able to answer, is the following :
What would an effective vaccine (say 95% effective) have looked like for covid?
I looked at the data for cases and deaths and it really didn’t look anything like I would have expected for a 95% effective vaccine. But was it just that my expectations were a bit off?
As you will already be too painfully aware, I’m not exactly the world’s greatest data scientist, and so I resorted to my usual approach; let’s have a play with the maths.
You Need To Get Your Sigmoids Seen To
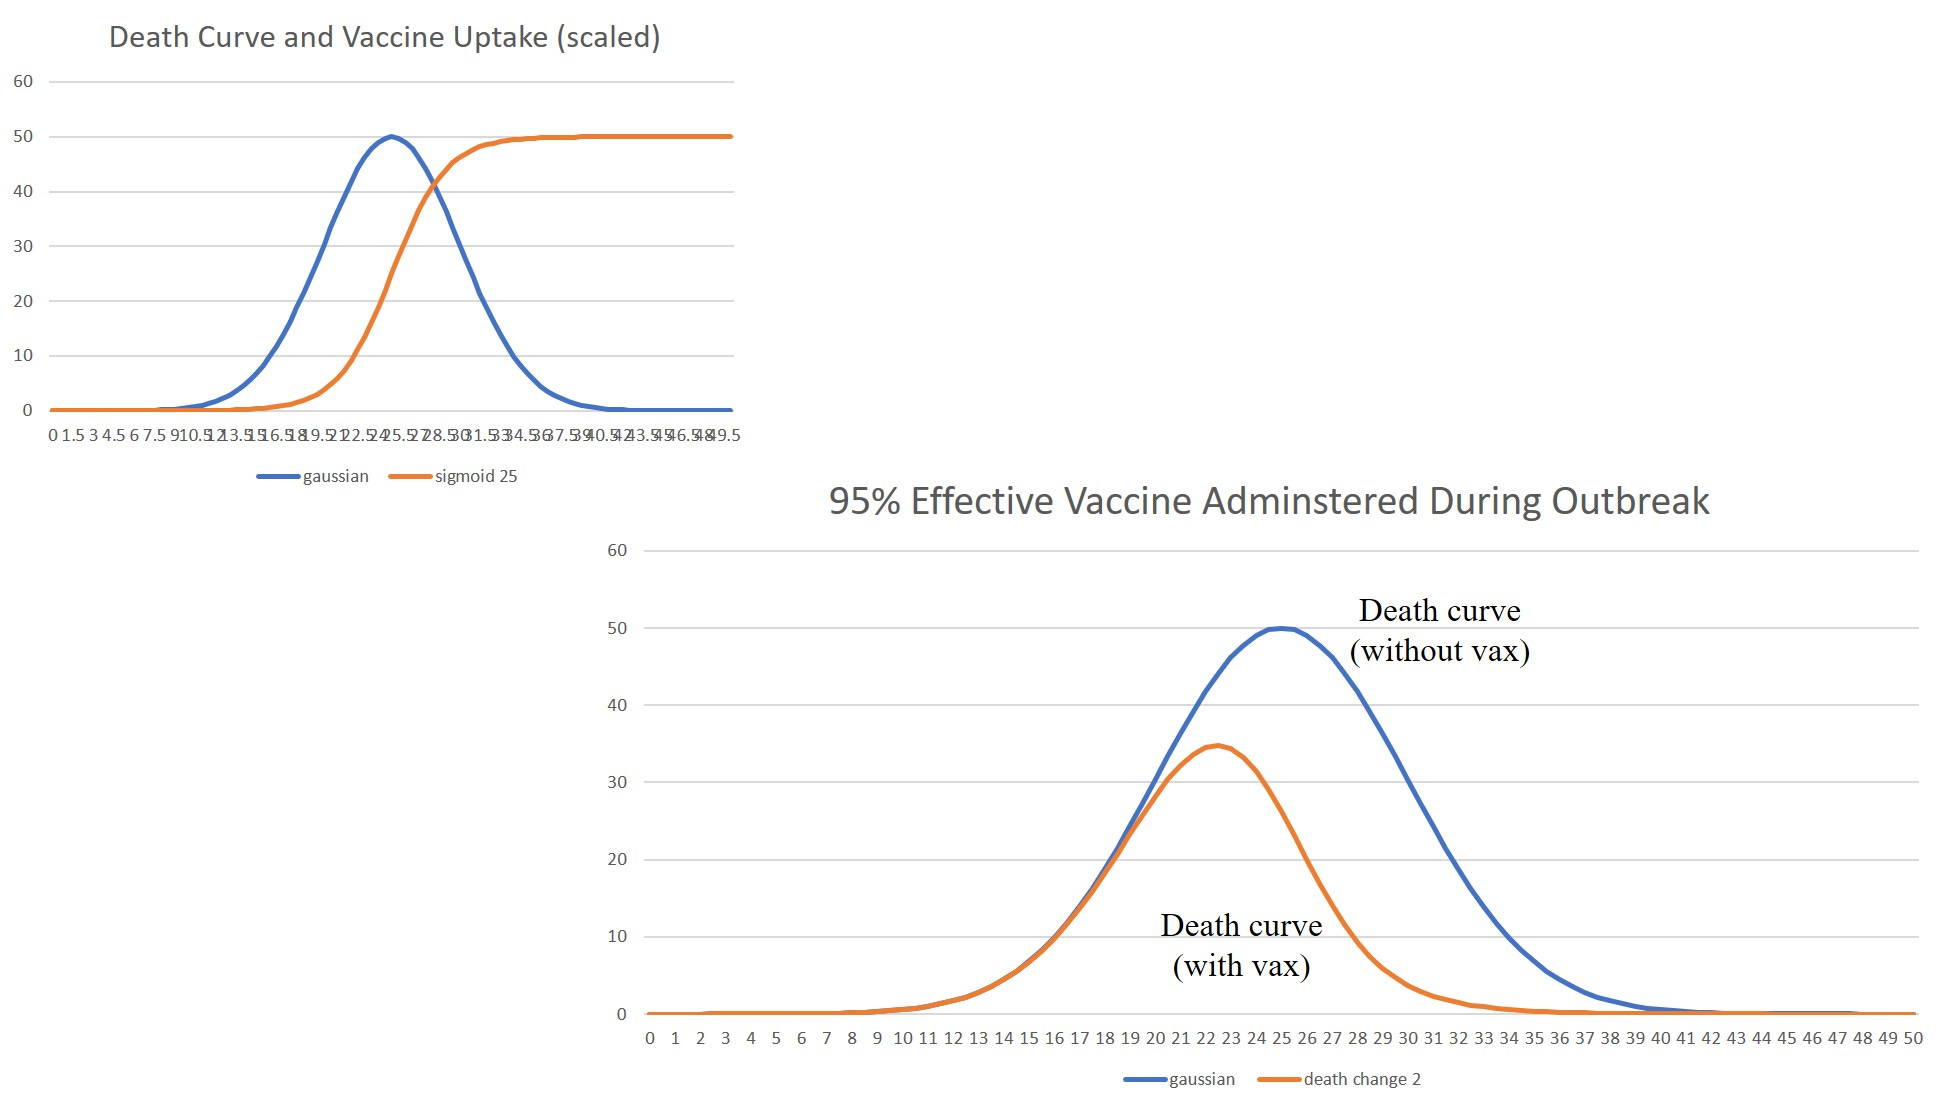
Here we have a bump, the death curve, and an S, the vaccination curve. I’m going to use the Gaussian function to model the bump and the sigmoid function to model vaccine uptake, both as functions of time.
The bump is more accurately represented by the Gompertz function, at least for temperate climes, and the work of Joel Smalley has shown what a very good fit to the observed covid data can be achieved using Gompertz functions. However, I’m going to use a Gaussian function (the Bell curve) because it’s a bit easier to work with. I’m interested here in qualitative changes rather than in trying to get any quantitative estimates - so using the Gaussian here (or any other ‘bump’-shaped curve) isn’t going to change things very much.
Here’s the formula for a Gaussian function
The A bit here tells you how high the peak of the bump is, the c bit allows you to adjust the width of the bump, and the b thing will allow you to shift it back and forth along the t axis.
In the graph below I’ve chosen A to be 50, b to be 25 (which puts the centre of the hump at t = 25) and the width parameter c is 0.02
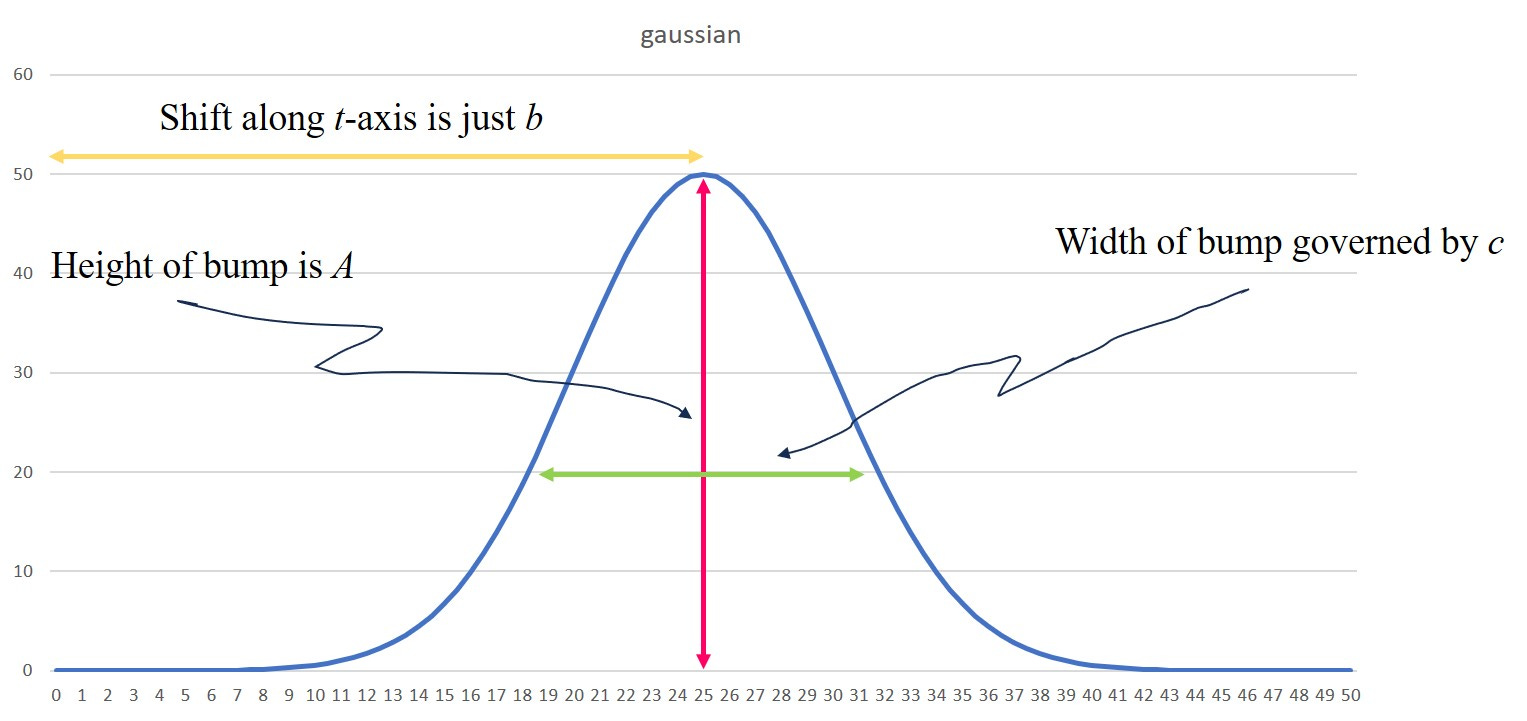
This, then, is going to be our covid death curve.
The sigmoid function is given by the formula
where the k here controls the steepness of the slope and the r is the ‘half-way’ point. This function varies between 0 and 1 and so the r is the value for the time such that the value of the function is 0.5 at that time. So this is acting like a shift parameter, just like b for the Gaussian. If we want to make the function vary between 0 and 0.8, say, we just multiply it by 0.8
Here’s what it looks like for a value of k = 0.5 and r = 25
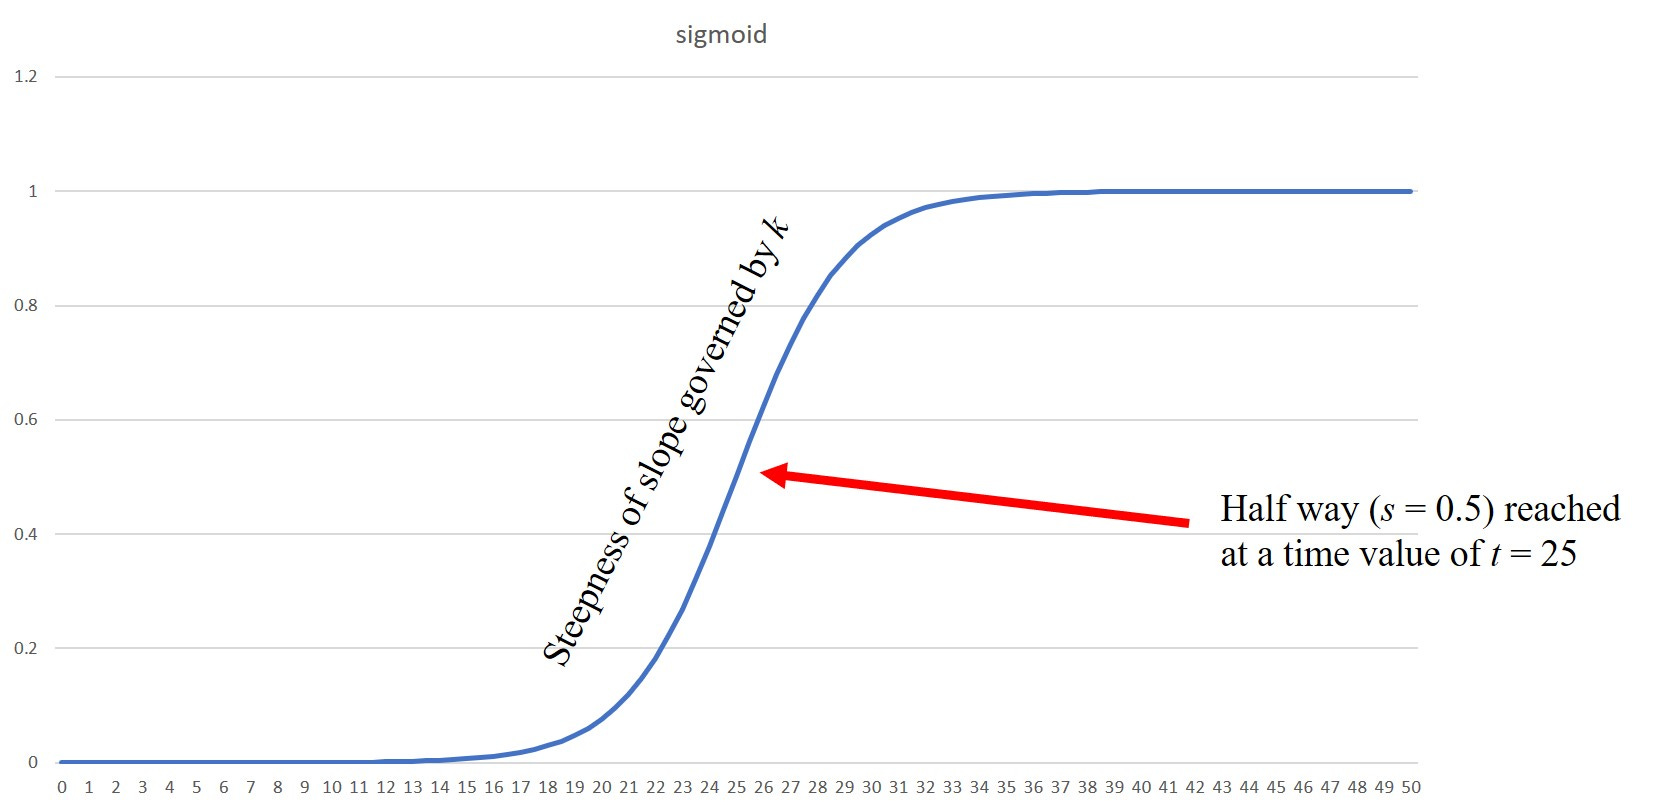
So you can see it’s not a bad curve to model the fractional uptake of the vaccine with. At t = 25 here we can see that 50% of the population will have had the shot.
I’m going to stick with the parameter values I’ve chosen for the Gaussian - the actual numbers are a bit irrelevant because I want to compare the no vax (the Gaussian) with what happens when we apply a vax program. I’m looking for changes in the overall appearance of the curve. With a 95% effective vaccine I’m kind of expecting quite a significant change.
What I will change is the r parameter, which is going to shift the sigmoid function back and forth a bit. So I can look at the effect of starting the vax program at different times during the progression of the outbreak.
So, suppose we (eventually) vaccinate everyone. The total number of deaths at any one time is then going to be made up of the stabbed and unstabbed. The proportion of stabbed vs unstabbed will vary with time as determined by the sigmoid function.
We have then for deaths, d
The epsilon here is the vax effectiveness. So if we pick a time when 20% have been stabbed we’d have s(t) = 0.2 and we have a 60% effective vax (so that this epsilon is equal to 0.6) then we get 40% of the deaths we’d expect had this proportion (given by the sigmoid function) of the population not been stabbed.
If the vax is not effective (epsilon is zero) then we just recover our original Gaussian, as expected. If the vax is perfectly effective (epsilon is 1) then when s(t) is getting close to 1, hardly anyone is dying; again as expected from a perfectly effective vax.
We can simplify that formula to give
What we have here is a Gaussian function modulated by a time varying ‘amplitude’ that is determined by the vax efficacy and the curve that describes vaccine uptake (the ‘amplitude’ is the bit in the square brackets).
Neil Before Me, Ye Modellers of Foul Odium
I’m going to try my best not to “do a Ferguson” and make crazy shit up. And so, for what it’s worth, here’s the output from my simple modelling.
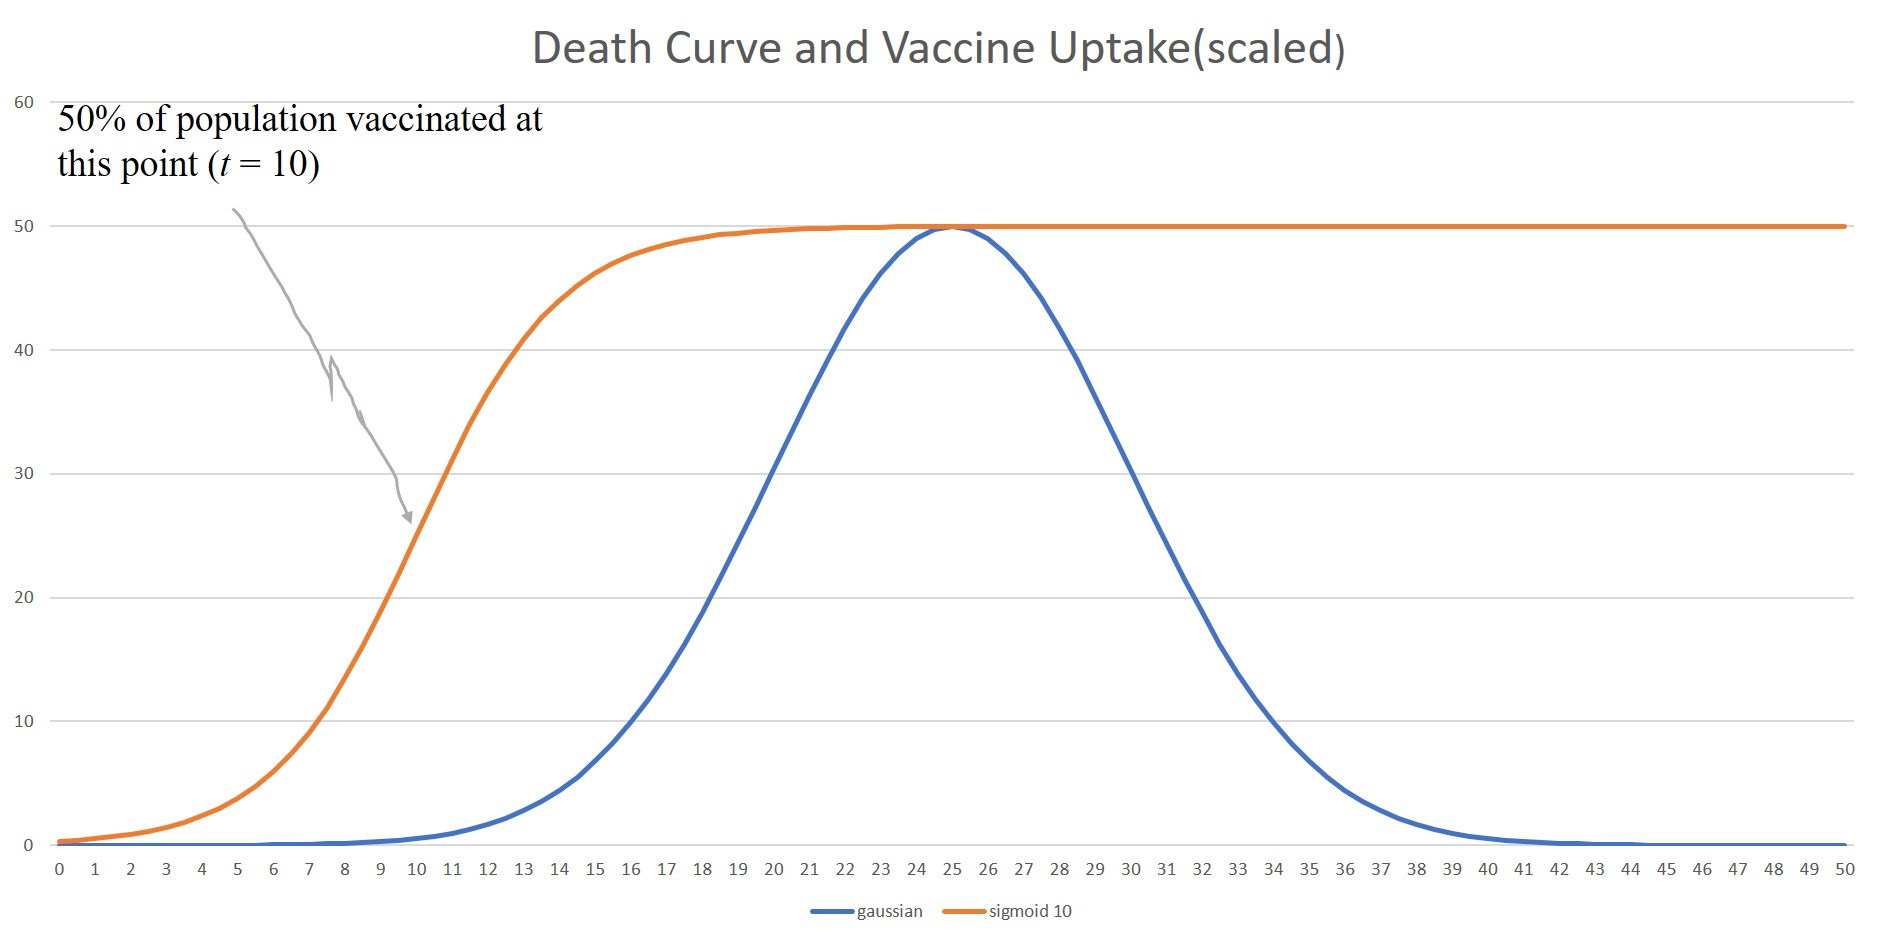
Case 1 : r = 10, everyone gets vaccinated (eventually)
The first “case study” is going to have the following conditions
The vaccine is largely administered before the disease peaks (r set to 10)
The vaccine is 95% effective
Eventually, 100% of the population is vaccinated (around the t = 20 mark)
I’ve plotted the death curve in the absence of vaccination and the vaccine uptake curve (For this chart, I’ve scaled the uptake curve by a factor of 50 to make it visible). The vaccine uptake curve represents the proportion of the population who have been stabbed. Here’s what this looks like
The thing we want to see is what effect this timely vaccination (with an effective vaccine) has on the death curve. Here’s what happens
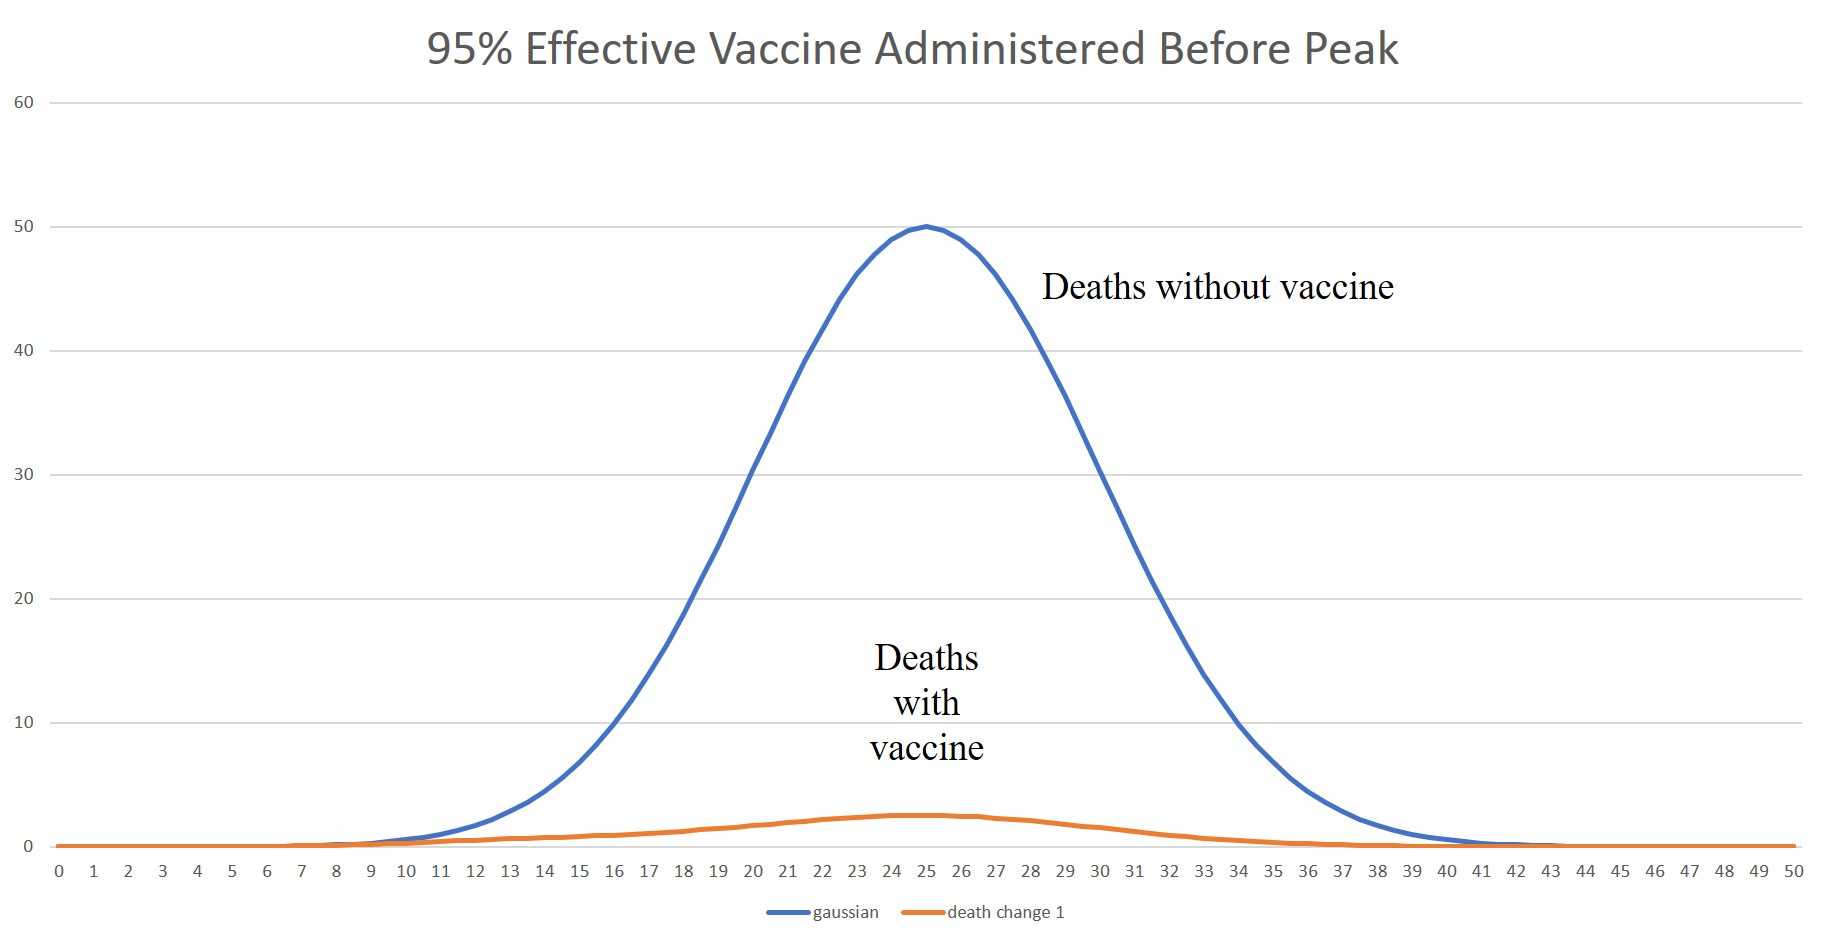
As expected, this timely intervention with an effective vaccine really changes things. By the time the peak would have been reached (without the vaccine) pretty much everyone has been vaccinated and deaths will be scaled down by 95%.
And here’s the juicy bit of counterfactual reasoning employed by some on Team BatShitCrazy™. When, despite vaccination, we still saw death ‘bumps’ they claimed that without the vaccine things would have been worse. Like 20 times worse? Because if you still cling to the belief of 95% effectiveness, that’s the kind of factor you have to suppose in order to maintain your belief in the 95% figure.
This was the essence of the “modelling” done by the team at Imperial4 when they suggested that in year 2 of the pandemic, without the vaccines, deaths would have been 10 times worse than in year 1. It’s such a ludicrous result, I can’t believe the authors took it seriously - or that it passed “peer review”.
But it just goes to show how captured the whole scientific process was when it came to covid.
The issue here, as I’m sure you’ve all spotted, is that we didn’t get the vaccination program to really kick in until way past the peak.
The question here is going to be whether with deaths falling naturally anyway (pandemics do this, you know - they goes up and they goes down. Ask Gompertz about it) we’re going to see much effect at all.
So let’s adjust the r parameter so that we’ve vaccinated half the population at the peak and see how that changes things. The r value we need to choose for this is r = 25.
Case 2 : r = 25, everyone gets vaccinated (eventually)
For this case we’ve shifted the onset of the vaccination program so that we achieve 50% vaccine coverage at the peak of the without vax death curve. Here’s what it looks like
You can now see that, whilst still a reasonably significant change, we’re not in the spectacular death reduction scenario we had for case 1.
Case 3 : r = 33, everyone gets vaccinated (eventually)
For this case we’re going have the disease already (naturally) dying down before the vaccination program really kicks in. This is what happened in practice, in the UK at least. Vaccination didn’t really reach significant population percentages until the 2nd wave had pretty much died out. Here’s a chart I produced a while back for covid deaths in England & Wales which splits the ‘covid’ deaths into age ranges and ‘impacts’. The data is taken from the ONS deaths by registration date spreadsheets - not really the best data to work with.
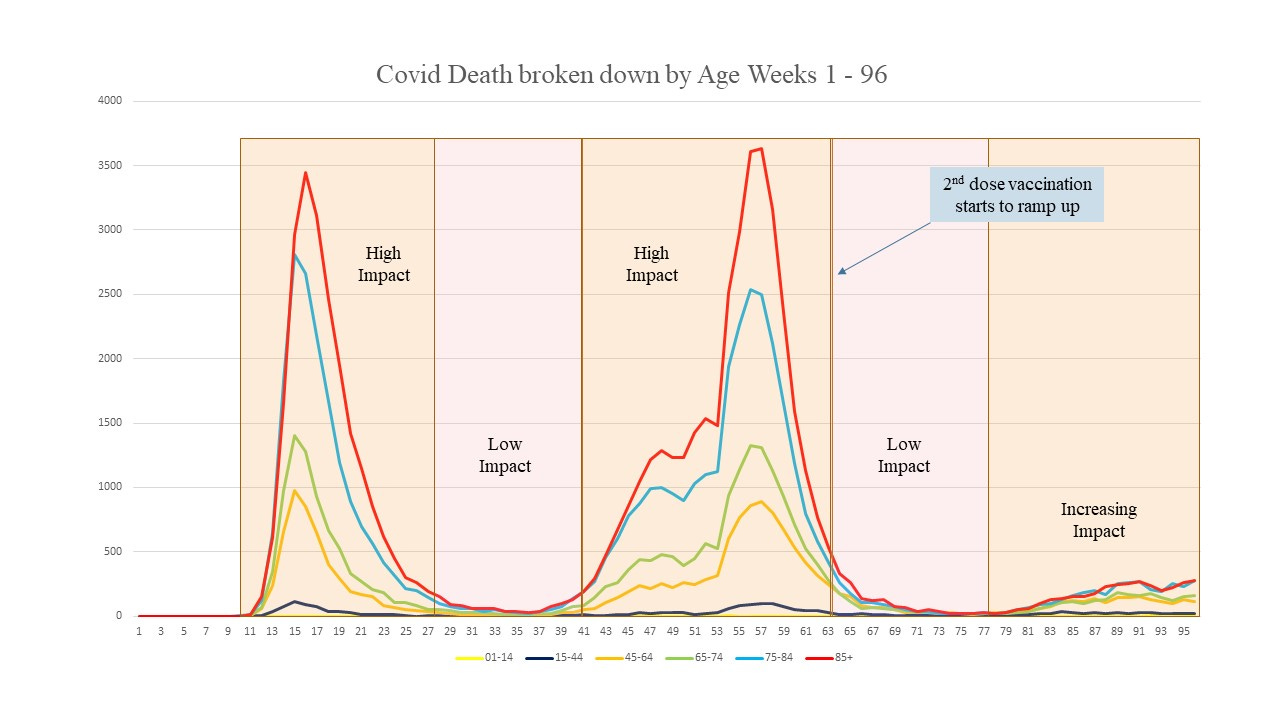
You can see that covid was essentially over by week 655, in the UK, but that was when the 2nd dose vaccine schedule really started to ramp up. I think Team BatShitCrazy™ kind of expected serious covid ‘waves’ to continue ad infinitum, which would make covid a spectacularly novel virus.
I’ve picked this chart because I wanted to refer to it again later.
OK, so what do the charts look like now? Here they are

You can see that, as expected, the change in the curves is not hugely significant.
It’s important to note here that I’ve taken a high vaccine efficacy and assumed everyone eventually gets stabbed. So, whilst not quite being a “best case” scenario, it’s a pretty damn good case scenario.
In practice, of course, the vaccine was nowhere near 95% effective and the percentage vaccinated might have only reached around 80% (overall).
Even with our pretty damn good case, we’re going to struggle to discern any vaccine effectiveness just by looking at the death curves when we vaccinate after the pandemic has mostly passed.
Be Still My Beating Heart . . .
. . . If it’s still beating properly after getting stabbed with the Concoction of Cardiac Corruption™
So I’ve finally figured out that I was searching in the wrong place. I wasn’t going to be able to discern any significant vaccine benefit from perusing the death charts anyway, because there was no significant benefit to be had. The deaths were coming down naturally all on their own.
If you expect covid to be some kind of virus on steroids and to continue Gompertzing all over the place from now until Kingdom come, then you’re probably going to think everyone should be vaccinated.
If you expect covid to behave like every other respiratory virus we know about in history, then the first and second waves (if there is one) are going to be about it; over and done.
In my view, once we’d got through the 2nd wave (which probably was only really significant because the 1st was out of season and cut short), we didn’t really need to worry about vaccination (assuming “safe and effective” haha) except for those most vulnerable.
What we appear to have achieved by trying to vaccinate everything that moved, and some that didn’t, is to completely bugger up the natural dynamics and evolution of the virus - which is kind of the point of vaccination, but we buggered things up in the wrong direction. And not to mention that we have completely screwed up some perfectly good and healthy immune systems.
And so we had the extraordinary spectacle of Scientists™ telling us that we still needed to be vaccinated even if we’d already been exposed to covid and had built up exposure-acquired immunity. They even came up with a whole new bit of science fiction science called “hybrid immunity”. It was, to put it bluntly, a fucking joke.
It was as if these utter buffoons were leering down their microscopes saying “wow - will you look at the antibodies on that one”.
But if the vaccine didn’t work, there’s always Remdesivir - that’ll finish you off if the vaccine didn’t. But under no circumstance should you ever take something like Ivermectin or HCQ - they’re just far too dangerous.
Dear God, I’m still, over 3 years later, trying to get my head round the magnitude and scale of the utter stupidity and deception that went on.
Did it Achieve Anything?
Even with a 95% effective vaccine (which it wasn’t) that doesn’t bugger things up in the wrong direction (which it did) and one that is safe (which it isn’t) we’re going to struggle to see any significant benefit if my contention is correct - that once the 2nd wave had passed there was little point in mass vaccination.
But where, then, if we vaccinate when the disease is naturally coming to an end anyway, do we find evidence of effectiveness?
One idea I had early on was to look at deaths differentiated by age. You can see from the chart above that the majority of deaths were in the more elderly. So, if these people were vaccinated first, we should be able to see a drop in the death stats correlated with age, with an effective vaccine.
I found some (small) drops, but I was working with data that was horribly compromised. It was death by date of registration data, and I was looking at ‘covid’ deaths - the labelling of which was more akin to some kind of necromancy than any science.
The only thing that has been truly effective during covid was the propagation of fear.
The aftermath has been horrific. In conclusion, I’d like to draw your attention to a chart produced by Coquin de Chien. It was a neat idea to look at mentions of died “suddenly” or “unexpectedly” in obituary death data. It’s quite amazing that this data exists. Here’s the chart for US obituaries

We might pause to think about bias in these stats, but they’re really rather revealing, don’t you think?
Have I vaxxed too lyrical, and just made shit up? You decide.
I did a very quick search for the cost of vaccines in the US and the prices the CDC quoted came out to be less than this. Prices are usually quoted for a 10 pack, and the cost varies, but a more reasonable cost per dose would be in the $5-$10 region.
This is The Speed of Science™ - a technique for teleporting vast sums of money from the gullible into the pockets of Pharma.
My initial reluctance was entirely due to my conviction that adequate safety and efficacy testing was simply not possible in the timescale. I’m glad I listened to my convictions.
Imperial, really? Oh goodness me, you do surprise me!
If you re-do this analysis, but look at excess all-cause mortality, you can clearly see that the 2nd covid ‘wave’ was of a lower impact in the UK - as we would expect. And all without the ‘benefits’ of the Goo.
So many tasty quotes, so much cynical history, so much illustration of uncomfortable truth with math. Well done! I too have spent three years wondering why I can't hear the Twilight Zone music. If you come up with an answer, particularly one based on QM, please share!
You do a wonderful job of explaining equations that look somewhat complicated (at least to those of us who don't have background in the subject) in such a say that the concepts behind them are very clear.