
That's Trendy

I wanted to write up a short note on at least one reason why things like “equity” are a POS1.
One of the core articles of ‘faith’ with equity arguments is that we’re basically all the same, statistically speaking. This may, or may not, be true. But, morally, we try not to think things like “men are better at maths than women” because that’s seen as sexist and/or misogynistic.
With that mindset in place, then, we look at a typical maths/physics dept at a university and see that, maybe, there are only 20% women faculty. Disgraceful! we say - must be some kind of discrimination going on - those sexist patriarchal pigs are holding women back.
But what if there was a trend for men to actually be better than women at maths by just a little bit?
It’s not a wholly crazy idea. We know and accept that there is a trend for men to be better at “spatial reasoning” and it’s possible this feeds into a slight advantage when it comes to maths.
How much of a trend does there have to be before we see a noticeable difference when it comes to faculty hiring?
Let’s assume, then, that there’s some parameter that determines math ability. Let’s measure it in units of Sheldon2.

We assess this parameter for women and find that the average for women is 50 Sheldon. We do the same thing for men and find it’s 52 Sheldon. That’s only a 4% difference - which seems like it’s more or less negligible.
Based on this we might reason that the male/female ratio in any math/physics dept should be about 1:1 - but we’d be wrong.
With any human characteristic - like height, or strength, or ‘intelligence’ - there’s going to be a distribution. Some men (like me) are going to be short arses, whilst others will be towering giants. Most, however, will be somewhere in between. Typically, these characteristics follow what is called a Gaussian distribution.
This is an important probability distribution - and I would say it’s the most important one. This is because of something called the Central Limit Theorem which, very (very) crudely, says that for large enough numbers everything looks Gaussian when it comes to stats.
If you’re not used to squiggly math stuff then the formula looks a bit frightening - but it’s really quite a lovely function when you’ve mastered a few squiggles. It looks like this
The ‘mu’ here is the mean value, and the ‘sigma’ is the width (the standard deviation). The bit in front of the exponential ‘exp’ is a normalization constant to make sure that the area under the curve is 1.
OK - let’s see what happens when we use this to model men and women with regard to our hypothesised parameter of ‘math ability’. We’re going to take the width (the spread) of the distribution to be the same for men and women and set it to 10. We’re going to have the mean value for women to be 50 and the mean value for men to be 52.
It’s easy to plot these things in Excel using the NORM.DIST function3 which works it all out for you, and we get the following curves
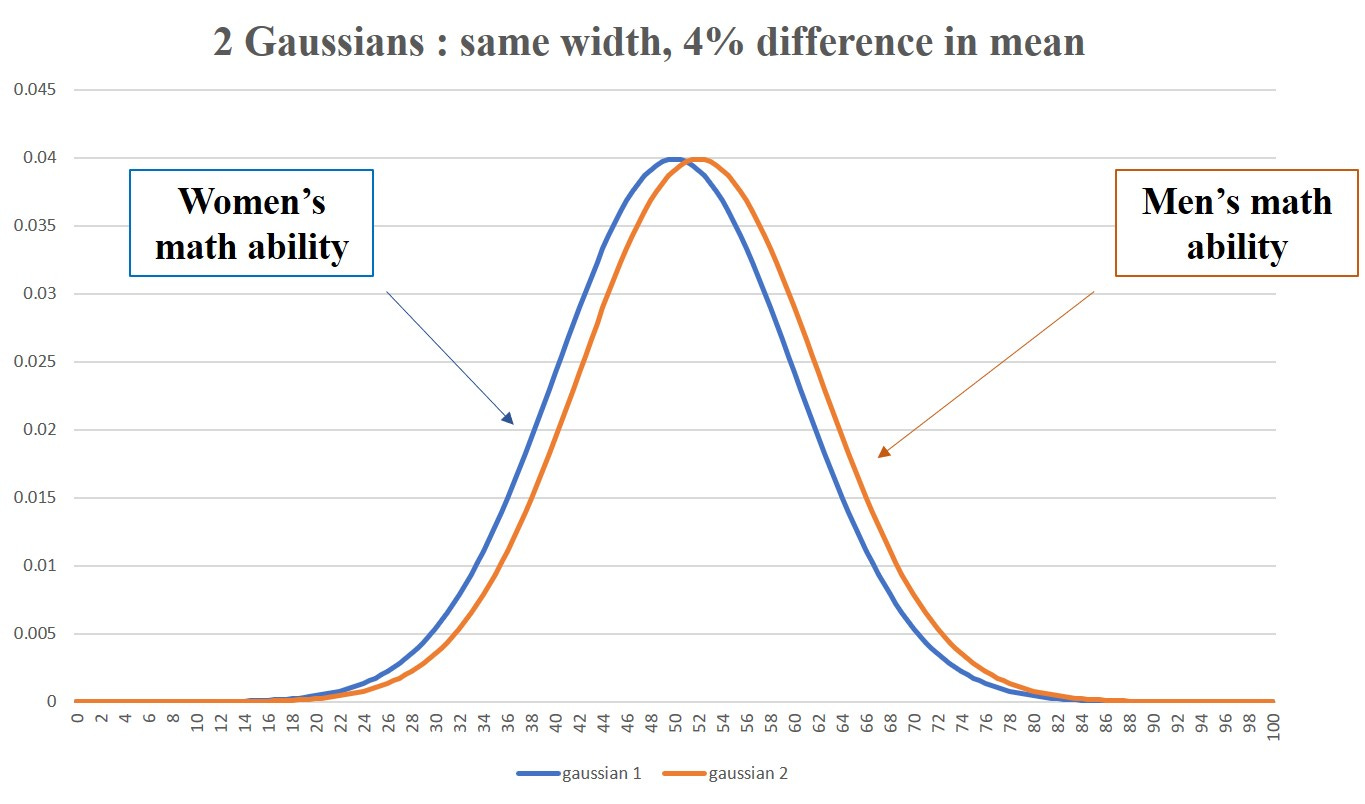
It’s the ‘bell’ curve. Here we have two of them with a considerable degree of overlap. OK - there’s a very slight nudge in favour of the blokes here, but you might not think this is all that significant.
But universities are not looking to hire the ‘average’. They want the Sheldons of this world. Let’s suppose that the minimum requirement would be that you are assessed at 90 Sheldons of math ability.
Let’s plot the ratio of these two distributions (man gaussian over woman gaussian)
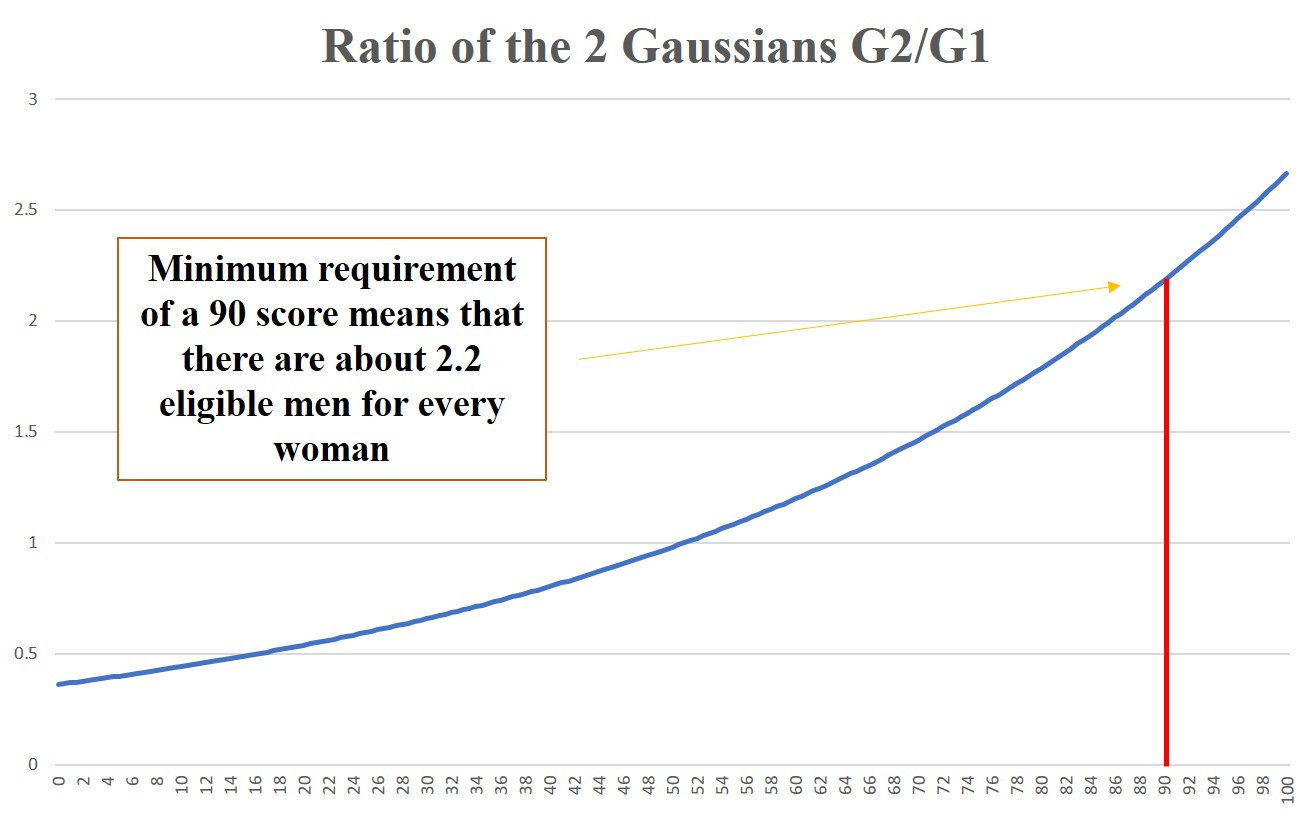
So, if these parameters represented reality and hiring processes were completely fair, then we’d expect roughly 2 men for every woman in a math/physics dept - or about 33% women faculty4.
I’m not, of course, saying anything new here. This disparate effect at the ‘wings’ of the distribution has been noted by many, many others.
This effect will occur anywhere where the ‘wings’ are important. Differences in speed or strength between men and women will be very significant for the top athletes, for example. I was once told of an interview in which John McEnroe was asked how many games Martina Navratilova would win against him. “Games?”, he replied, “She’d be lucky to win a point”.
No idea whether this is (a) a true quote or (b) properly remembered by me - but it illustrates something that we all know to be true. With overwhelming probability it is true that some women will be stronger than most men but no woman will be stronger than all men.
And differences in the average strength/speed between men and women are significantly more than 4% which is the example we considered here for ‘math ability’.
And this focuses only on ability - we haven’t considered what kind of career women might want. Here again there’s a potential difference. We know that there’s a measurable trend difference between girl and boy babies when it comes faces vs things. Boy babies tend to be a bit more interested in things, whereas girl babies tend to be more interested in faces. Again, this won’t have to be a massive difference in the mean if something like this has an effect at the ‘wings’ when it comes to men vs women in maths/physics careers.
The point here is that whilst past discrimination almost certainly played a role (and there are historical examples of such discrimination eg Emmy Noether) it is by no means the whole story when it comes to unequal outcomes in the make up of maths/physics faculty. These days I would suggest it’s not a factor at all.
I’ve been on hiring panels lots of times in my career (for at least the last 30+ years) - maybe I was lucky - but there was never any bias against female applicants. Quite the opposite in fact - and this is not a recent development - but one that was evident right from the start of my career.
In my view, there is something other than patriarchal nasty misogynistic men things responsible for the inequity in men vs women in university math/physics departments.
Forcing equity is not the right thing to do.
Pile of Silliness - although please feel free to substitute your own word for the S here
Curiously, Sheldon himself was assessed at 99 Sheldon.
The gaussian distribution is often also called the normal distribution
Actually, you need to compare the ratio of areas under the curves beyond the point 90 - but this gives roughly the same answer and adds a bit more technicality that detracts from the main point.
The Gaussian distribution has rapidly decreasing tails. In the real world, heavy tails are the rule, not the exception. See Nassim Taleb's "black swan" theory, https://en.wikipedia.org/wiki/Black_swan_theory. Have you tried doing your calculation for the Cauchy distribution?
All (non-intellectually handicapped) humans can grasp a lot of math— our brains are magnificently designed for pattern recognition. It’s why we do as many kinds of practice problems as possible, and repeat them over and over— so hopefully when we get them on the test, we recognize what to do. In mathematics, as in a lot of other things in life, I’ve come to think that the willingness to put in time and practice far exceeds the importance of any natural gifts. My child who is the least mathematically gifted does the best on her tests because she is a hard worker and not a lazy person who makes stupid mistakes and doesn’t check her work because to do so is “boring.”
With that said, I think if you were to study siblings of different sexes who are raised in the exact same environment, you’d tend to find that the girls are more verbally gifted and the boys more mathematically gifted. I have a son who is extremely verbally gifted— and yet his talents are nothing like his sisters’. I have a daughter who I thought was mathematically gifted— until I began to work with her younger brother. But what really ultimately matters is that if either of them gets used to things being “easy” for them early in and becomes lazy and careless, none of these talents do them any good. There is no substitute for hard work and struggle except the manipulations of humans on the side of evil— which is what discrimination or favoritism on the basis of physical characteristics really is.