Placebile Motion (Part I)

*Note : I’m going to be writing a few simple equations. It has been noted that, recently, the Substack app on phones is not rendering these equations at all and you just get a blank box. I think it’s true for the email version of the post too. So, unless it’s been fixed, if you want to see the equations you’ll have to view this on a PC I think.
Ever since I learned, largely from Professors Fenton and Neill (but also others), about how it’s possible to make even a placebo look effective by various manipulations, I’ve been fascinated by how it’s possible to mangle the interpretation of time-series data.
So, this is going to be the first in a series of looking at these various mangling possibilities.
Want to make a placebo look effective? Sure thing. You want the mis-categorisation technique, or the reporting delay technique, and how about we throw in a little survivorship bias into the mix too? For a little extra we can go with the gold plan and throw in some healthy user bias in there too.
Profs Fenton and Neill have a real gift for explaining all of these things in a way that is very easy to digest and understand but, statistical nincompoopy dunderhead that I am, I still sometimes struggle to feel I’ve properly understood what’s going on.
So, a lot of my effort has been focused on trying to figure out simple algebraic techniques that can, possibly, give me further insight. Unfortunately, it’s very easy to make things too simple when doing this kind of thing.
The picture in the real world is pretty complicated. You’ve got a series of shots given out in a time-dependent way that itself depends on things like age and whether one was deemed to be an ‘essential’ worker set against a background of time-dependent disease prevalence, time-dependent virulence, and time-dependent natural (disease-acquired) immunity - and so on.
Disentangling any ‘efficacy signal’ out of this complex time-evolving picture is not going to be easy from a technical point of view.
There are also considerable uncertainties in the relevant data. What kind of ‘calculation’ result are we going to get when one government department claims 80% of the population has been stabbed, but another claims it’s 90% ? Or when a ‘covid’ death depends on some dodgy PCR test result, how are we to trust the claimed figures?
The approach to complex problems usually (for me, anyway) is to start with a simple idealized model that I can solve. This model will capture some elements of ‘reality’, but will need to be refined and made more realistic, which usually means ‘made more complicated’. The hope is that any such simple model is still useful enough to give us some insight and is a reasonable first stab at describing ‘reality’.
So what I wanted to try to look at today is a very simple model of ‘vaccination’ with a ‘placebo’. In this case the placebo is, quite literally, do nothing.
Basically, what I want to examine is, even within an extremely simple model, how many ways can we fuck it up?
I should emphasize that I’m not doing anything new here - all of the things I want to talk about here (and in subsequent articles) have been uncovered by others.
The Basic Protocol
The basic simple protocol I’ll look at is a ‘vaccine’ trial that lasts for 8 weeks. I’m going to assume there’s a constant background death rate over this period.
Split population into two groups of equal size (N)
Each of these groups is assumed statistically ‘identical’ (avoiding sources of bias)
The control group go into the SCUM room - they’re ‘unvaccinated’ so we’re allowed to call them that, right?
The placebo group, initially, go into the LIMBO room. Nothing is done to them. They sit around twiddling their thumbs, playing on their X-Box, or writing snarky articles on Substack. Regrettably, because there’s this background death rate, some of them will pop their clogs1 during this period in LIMBO.
After 2 weeks in LIMBO the survivors are transferred into the HERO room. Being classed as ‘vaccinated’ makes them, practically, Captain America.
After 8 weeks both control and intervention groups are allowed out and we can compare numbers.
Because there’s a constant background death rate the numbers exiting the SCUM room and the HERO room will be equal2.
The picture looks like this
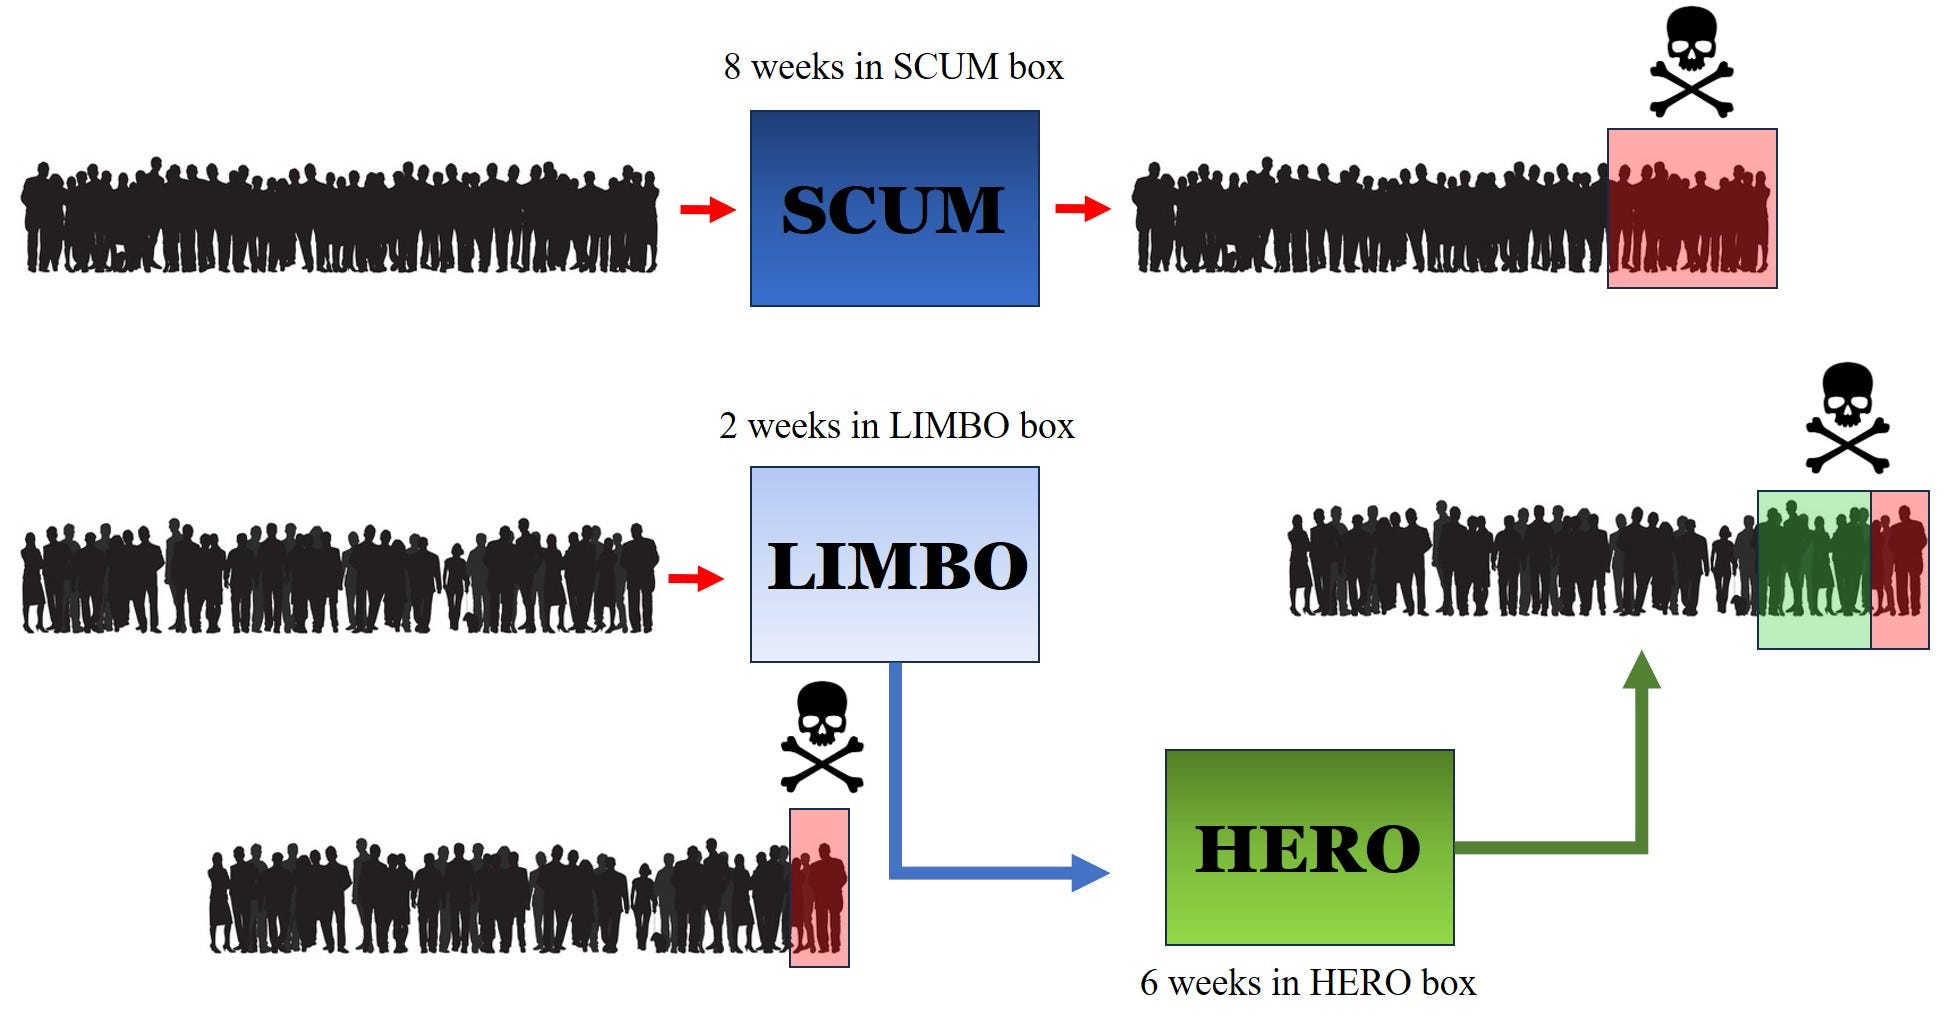
Other than being put into different rooms, or boxes, nothing is done to distinguish the populations in any way.
We’re now going to put ourselves into the position of a bad person; an entirely hypothetical Pharma executive who wants to manipulate things so that it looks like being ‘vaccinated’ (i.e. just put into LIMBO initially) was the best option. This is fanciful because we know, beyond any shadow of a doubt, with not a scintilla of suspicion, that Pharma Execs would never, not in 1 million years, not in 1 billion years, ever consider doing such a thing.
The assumption of a constant background death rate might be expressed in terms of a fractional rate per week. So we might think of 10% dying per week - which would be crazy high. This gives us an exponential reduction in population. Think of it in terms of cutting a ribbon; start off with 100cm and after the first week cut 10% of it. You’re left with 90cm. Do the same after the second week and you now cut 10% of 90cm, which is 9cm, and so you’re left with 81cm of ribbon after week 2. And so on.
You can work all this out in terms of exponentials - and remember that, despite frenzied media abuse of this word, exponential does not necessarily mean ‘out of control’ or even ‘fast’. But we’re not going to do all that (even though it’s fairly simple to do). We’re just going to assume specific deaths at each stage and use the subscripts S, L or H to distinguish the various boxes.
The Correct Answer
Before we look at the various ways of doing this the wrong way we need to ask ourselves what is the right way?
As with a lot of these kinds of problems it’s all about asking the right questions, or sometimes the right question in the right way. Here, the question that we want answering is the following
Am I better off being (initially) chosen for the SCUM box or for the LIMBO box?
The answer here is crystal clear; it doesn’t matter. There’s no difference in outcome. You face the same risk (this assumed constant background rate) in either box. Note also that this result does not depend on the assumption of a constant background rate - only that the background rate, whatever it is and however it varies with time, is the same for both boxes.
If, for example, you had (somehow) chosen people who were more healthy, on average, to go into LIMBO then the background rate would be different for the 2 boxes. In this case, even though literally nothing had been done, you’d find an illusory ‘efficacy’ because people in LIMBO would be dying at a reduced rate.
For the ordinary person, as opposed to the Pharma researcher, the question is should I get stabbed or not? It is stabbed vs unstabbed that is the critical split. Now, the issue here is that by introducing a second split around what constitutes being vaccinated - which is not the same as being stabbed - is what allows the possibility of uncertainty, or perhaps we should say chicanery, to occur.
So, for example, you are not considered vaccinated until a certain time period has elapsed. There might even be a further split that distinguishes between ‘fully’ vaccinated and vaccinated when more than one shot is required. We saw this in a recent paper that purported to show the benefits of the vaccine, but chose to describe some people as ‘under vaccinated’.
The Parameter of Persuasion
The thing we are going to calculate is something called the efficacy. We’ve seen it before, but for completeness let’s just remind ourselves of what it is.
This is a parameter that looks at the change in something divided by the original amount of that something.
So, if there was a shop sale and you went in to buy one of your favourite products only to find its price had reduced from $1 to $0.9 it’s easy to work out the ‘efficacy’ of the sale. You need the change, which is $0.1, divided by the original amount, which is $1. The ‘efficacy’ is then 0.1 (or 10% if you want to express this as a percentage).
We can think of the original price as the price before the ‘intervention’.
With a vaccine trial you calculate rate (without intervention) minus rate (with intervention) to get the change. You then divide this by the rate (without intervention). It’s often expressed in the following way
which is just the same thing after a tiny bit of algebra. The ‘i’ subscript stands for intervention and the ‘0’ subscript means without intervention.
Now that we know what we’re trying to work out - let’s just do it and see how to get it all wrong.
You’ve been stabbed, but you’re not a Hero yet
The idea of the LIMBO room is to simulate this notion that someone, despite being stabbed, wasn’t actually considered to be vaccinated until some time had elapsed. The rationale for this was that it took time for the shot to ‘kick in’ and so its efficacy could only be determined by looking at its effect on those who had gone through this ‘Limbo’ period.
The obvious problem with this is that if, for some reason, the shot makes you more vulnerable in this Limbo period, then ignoring this Limbo period is going to skew the results by introducing a survivor bias into the HERO box. The data3 from Alberta, Canada, in which something like 50% of ‘covid’ deaths (in the stabbed) occurred in the first couple of weeks after being stabbed, strongly suggests that the shot increased the risk (the background rate) quite considerably.
If you add in a ‘healthy vaccinee effect’ there, too, in which it is supposed that (on average) healthier people were more likely to get stabbed, it looks even worse for the jab. This increased risk (observed in Alberta) would then be in a group that is (on average) more healthy!
But in our basic protocol we’re not elevating the risk of being in LIMBO. Let’s run the numbers (badly) anyway and see what happens.
The first way we can mess things up whilst seeming to do everything right is to ignore the difference in the time spent in the rooms.
We ‘accept’ the argument that we should only be comparing those who survived LIMBO with the SCUM. The death rates in the 2 boxes (HERO and SCUM) are then
where the D symbol stands for the number of deaths.
If we note that the death in LIMBO plus the deaths in HERO are equal to the deaths in SCUM, and introduce fractions f and g so that
D(Scum) = gN
D(Hero) = fD(Scum) = fgN
we can rewrite everything in terms of these f and g terms (I won’t go through the details). We end up with an expression for the efficacy that looks like this :
The g here is the background rate (averaged over the 8 weeks) and we’re not expecting 50% of those who enter the SCUM box to die. It won’t even be 1%, typically (even during covid we didn’t see an overall IFR anything like 1%). So we can see that g is going to be typically smaller than 0.01 (and the ‘background’ all-cause mortality rate for an entire year for somewhere like the UK is around 1%).
This means that to an extremely good approximation our efficacy is just 1 - f.
This means that if, say, you get 60% of the deaths in HERO than you do in SCUM we’re going to assess the ‘efficacy’, according to this flawed calculation, as being 0.4 (or 40%).
What’s gone wrong here is that we’ve not accounted for time. The people in HERO have been exposed to 6 weeks of background risk, whereas the people in SCUM have been exposed to the full 8 weeks. This is one very good reason to redo the whole analysis in terms of person weeks, which is a way of ‘matching’ the risk exposure over different time periods.
This is the first way we can mess things up, despite looking like we’ve tried to do it all properly. From here on in it gets worse.
I’ll look at those in the next instalments. I want to try to keep things to a reasonable length.
One last thing I will say is that it’s crucial to get the data right. If you overcount the numbers vaccinated, or undercount those unvaccinated, for example, your calculations of efficacy are going to be all to cock4.
Summary
We know that there was a distinction drawn between those recently stabbed and those considered to be ‘vaccinated’. Unless you’re careful with your analyses it’s easy to create an illusion of efficacy even when the ‘vaccine’ is a placebo. Whether the various claims of ‘efficacy’ suffered from this error is open to debate. Various statistical agencies (the ONS in the UK, for example) claimed they did not make this mistake.
This is another reason why the full record-level data is important. The supplementary question of whether we can actually trust that data, were it ever to be released, is a separate issue.
I’ll look at more (even worse) ways to mess things up in subsequent posts.
Another of those weird idioms that make no sense. How popping one’s clogs (whatever that means) became synonymous with dying is one of life’s mysteries - and I don’t want Google to spoil the mystery for me, either. It’ll probably have racist or white supremacist origins.
Yes, yes, I know there will be fluctuations about the mean and all that, but for the purposes of this exercise we’re just going to forget statistical fluctuations
I think I’m right in saying that when this data was noticed and brought to people’s attention it was removed from the relevant official website.
Bizarre idiom number 2
Popping something is an old fashioned slang term for pawning something.
A working man or woman in the north of England would need their clogs until they died, unlike their overcoat or Sunday clothes that could be pawned on a Monday and redeemed on a Friday.
So Pop Goes the Weasel means pawning one’s Sunday coat (weasel & stoat) to buy the half pound of tuppenny rice.
But you could only pop your clogs if you no longer needed them - that is if you were dead.
Just reporting that the equations rendered properly when reading the email of this article on my iPhone.
Thanks!