
Person-Years : more mundane musings
Person-Years : more mundane musings

Note : this is going to be somewhat mundane (and I’m getting the “too long for email notice” coming up). I’m sorry. I wanted to do an exploration of person-years. What you’ll get is a probably tortuous exposition of my thinking as it occurs. I don’t actually know the answers I’ll get at this point. I’m working it out and writing as I go. It might take me a while.
Some of you may find this interesting; most will not. But look on the bright side - if you’re having difficulty getting to sleep at night then just read this. (I’ll do a TL;DR at the end when I’ve got the results worked out).
What might be more of interest is the process itself. This is the kind of thing we have to do when faced with any unfamiliar new concept; you try it out on various scenarios to see if it makes sense. Very often, after a while of doing silly things, you’ll come to the conclusion that it was all obvious to begin with and you really didn’t need to do all that faffing about.
What I’m really trying to find out is whether the use of person-years introduces any kind of “funny business” I ought to be aware of.
In a previous piece I was trying to get my head round the idea of a person-year as it pertains to clinical trial data. We saw that the UK’s covid vaccine data was presented by the ONS in terms of an Age-Standardised Mortality Rate per 100,000 Person Years (ASMR per 100k PY).
I wanted to have a short1 look at a simplified model in order to get a bit more understanding of using this PY approach.
Suppose you started off with a bunch of people in a trial and no new victims volunteers are added. If you want to approach this mathematically then you’d be looking at some kind of population attrition function f(t) which gives the number still in the trial at some time t later. You’d then have to do some integration to get to an expression for person-years as a function of time elapsed in the trial. In order to avoid this inconvenience we can use a rather artificial model that allows us to calculate PY much more simply.
The trial in this artificial model will consist of the following. We’ll start off with our volunteers and then after 4 months some of them will be given drug A. After another 4 months some of those who were given drug A will be given drug B. At the end of the trial after another 4 months, we’ll see who’s left. So the trial lasts for 1 year.
The artificiality arises because I’m going to assume a very odd disease - no more odd than covid being able to tell when the pub closes at 10pm, perhaps - in which all the deaths occur at these 4 month points. This is an artificial device to allow us to calculate person-years very simply.
The idea here is that drug A makes things worse, but then drug B makes things better. In order to get the full protection of A + B you have to go through the more dangerous A stage. This is similar to what we saw in the ONS data for the covid vaccines expressed in terms of a mortality rate per person-years.
What I want to do is to see whether the picture looks different in terms of total mortality over the year to when we cast everything in terms of person-years.
The Placebo Trial
In order to get us started we’re going to assume that both of the drugs, A and B, are placebos. This will allow us to use a single death rate for all people in the trial and will also give us a bit of practice in how the calculation unfolds.
0 - 4 Months
We start off with N people. Just before the next 4 month window where drug A is administered, we have d people dying giving us a death rate in the absence of any intervention of r = d/N.
Each person has contributed a time, T, to the study so far, where T = 4 months, or just 1/3 when expressed in person-years.
The mortality rate per person-year is then just d/NT = r/T
4 - 8 months
Now we’re starting off with N - d people which can be written as N(1 - r).
We have a fraction, p, being given drug A so that at the end of the 4 month window we have :
Deaths in A : rpN(1 - r)
Deaths in C : r(1 - p)N(1 - r)
where I’ve used C to denote the “control” group who don’t take any drug at all.
We can see the rationale for using person-years here, because if we want to split things into drugged vs not-drugged for the total 8 month period we can see that the drugged spent some time as “not-drugged” during the 0 - 4 month phase of the trial.
We can still do this, of course, but we need to be aware that some of the deaths in the drugged population will have occurred before they took the drug. I’ll come back to this in a bit, but for now let’s work out the picture in terms of person-years.
Person-Years in A : pN(1 - r)T
Person-Years in C : NT + (1 - p)N(1 - r)T
If you work out the mortality rate (per PY) for the drugged and for the non-drugged you find, as expected, that it’s just r/T.
The use of person-years here is not throwing up any surprises. I’ll stop here because going on to the 8 - 12 month part of the trial just adds more algebra but no different conclusion.
The Non-Placebo Trial
What new thing do we need to add in here? Well, we are now going to assume that the drugs change the base (no drug) mortality rate. We’re going to write the new mortality rate for those who just take A as ar and that for those who go on to take B as br. The parameters a and b are just multipliers for the base rate; if a,b > 1 then they make this rate higher (worse), and if a,b < 1 they make this rate lower (better).
4 - 8 months
The 0 - 4 month period is the same as before, so let’s begin with the 2nd phase of the trial.
At the start of this period we have N(1 - r) people and a fraction p of these take the drug A. But now we have that extra ‘a’, which gives the change in the base mortality rate, to consider
Deaths in A : arpN(1 - r)
Deaths in C : r(1 - p)N(1 - r)
Because we’ve assumed (artificially for convenience) that the deaths occur just at the end of this period the person-years don’t change from before.
And working out the mortality rate per PY doesn’t throw up any surprises here, either. We find that it’s r/T for the C group and ar/T for the drugged group.
The approach of using per PY here is matching up with expectations and giving us sensible answers.
Interlude : Another Approach?
Before we add in drugged group B where the algebra gets a bit more involved, let’s see about another possible approach to the data.
We’re going to consider the 0 - 8 months as our trial, but at the start of the trial we’re going to split the total into two “rooms”. In room C are those who will not get the drug A, and in room A are those who will, eventually, be given the drug. The fraction of the initial total who get the drug will be p.
We’re going to follow the fortunes of the people in the two rooms. It looks, pictorially, like this :
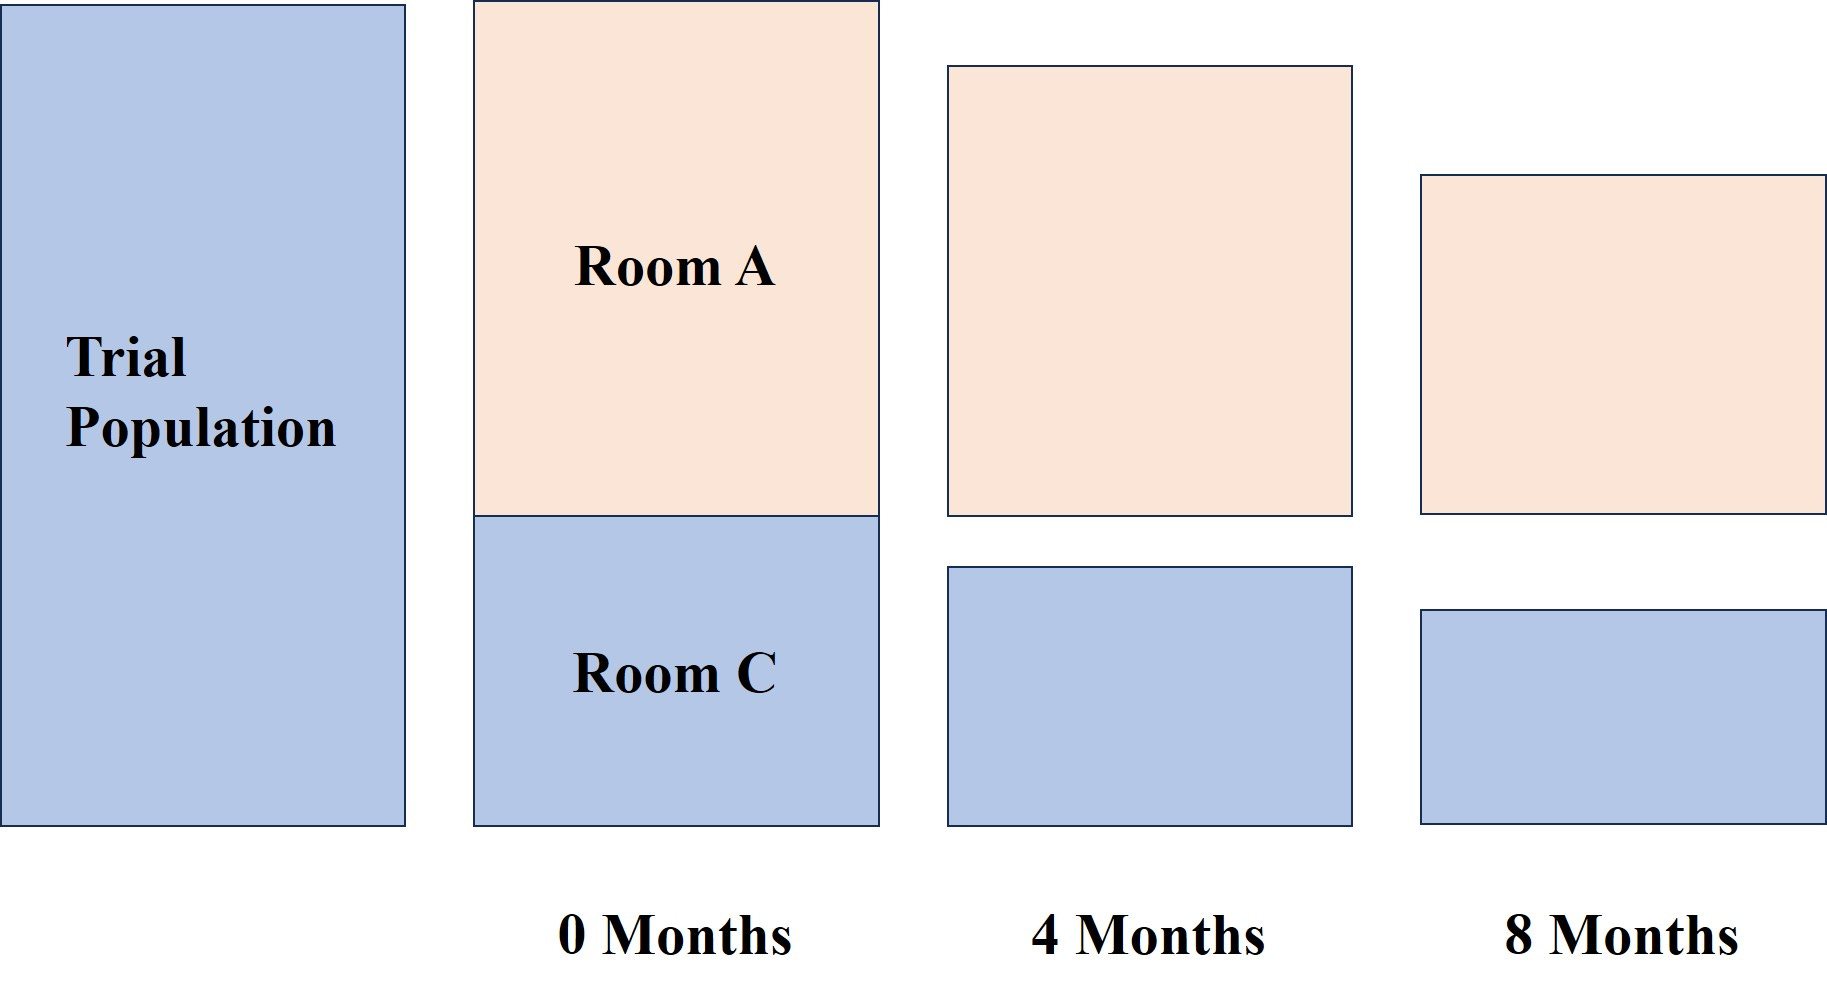
So you can see that the number of people in the “rooms” decreases as the trial progresses. Let’s follow the rooms with N people enrolled in total at the start.
Start :
Room A : number of people pN
Room C : number of people (1 - p)N
End :
After 4 months we get rpN deaths in room A. The survivors are then given drug A and at the end of another 4 months a fraction ar of these have died. So we have, for the number of fatalities in room A
If we write q = 1 - p we have the number of fatalities in room C being
The mortality rate in terms of number dead divided by initial numbers in the rooms is just going to be
The question we’re trying to answer here is
Which room do I want to be put in?
When a = 1 (the placebo trial) we get identical rates for the two rooms and so it doesn’t matter.
Now, notice that the deaths in the A room are a mix of drugged and non-drugged deaths. We’re not faffing about trying to figure out the relative risk in terms of person-years, but trying to figure out which room you’d rather be put in at the start of the trial.
In other words, if I get put in room A am I more likely to survive to the end than if I get put in room C?
With this simple example it’s fairly clear that if a < 1, then you’re going to hope you get put into room A (with the opposite hope if a > 1).
So, the same conclusion you’d come to in terms of person-years.
Does the person-year approach and the “room” approach agree when we introduce the last phase of the trial?
The Final Trial Stage
This gets a bit more involved now, but I hope you can see the process. You just keep track of the changing populations2. I’ll try not to overdo the details and just present the results.
We end up with 3 populations, A, B and C. Population A has taken drug A. Population B has taken both drugs A and B. Population C, our control group, has remained resolutely drug-free.
Deaths in C
We start with N people in C, after 4 months we have (1 - p)N minus those who died. After 8 months we have a further number of people in this group who die. I’m going to use a capital D to denote deaths here to distinguish it from the “room” approach.
If you track it properly, and using q = 1 - p, as before, then you find that the total number of people who die whilst classed as members of the C group is
In order to get the rate per PY we need to divide this by the number of PY in C.
This is just
and so we get our r/T rate as before. Splendid. Just what the doctor ordered.
The calculations for the A and B group are a bit more involved because we’ve now got the different death rates ar and br - and we also have a fraction (let’s call this f) of group A becoming members of group B.
Deaths in A
I’ll just present the results here, and hope I’ve done the algebra right.
And, hey presto, we end up with the mortality rate of ar/T in terms of person-years.
So, the use of person-years is becoming clearer as we muddle our way through this example. It’s not introducing any “funny business” in terms of a sensible rate. The rates (r vs. ar) between the C and A groups are maintained as hoped (expected?).
But . . .
Here I’ve used an identical time period, T, for each arm of the trial. This is to make the calculations more convenient, but it’s also unrealistic and before I go all “hey, PY’s are really cool things” I would want to re-run a calculation with differing time periods for the phases.
The real issue I want to get at is how we combine the results into drugged vs undrugged in this trial - what’s the “best” way of doing that?
Deaths in B
The results here are a bit easier because the B group only contributes a single time period, T, to the trial3.
And there is no surprise by now that this gives us the mortality rate in per PY as br/T.
Drugged vs Undrugged?
Before we take a look at the “room” approach, our next job is to figure out how to combine these results.
Based on the rates in PY are you better off taking some drug (either A, or A and B, in this case) or better off taking none at all?
We’re, of course, interested in this kind of thing being able to cast some light on the covid “vaccines” and the ONS dataset that purported to claim that in terms of PY you’re better off taking the vaccine.
The ONS used an averaging procedure to get their final mortality rate for the vaxxed versus the never-vaxxed. The procedure they used was to take the total number of vaxxed deaths and divide those by the total number of person-years as vaxxed. In terms of our hypothetical example with drugs A and B, the averaging procedure is this
And now, unfortunately, we’re ending up in algebraic gloop. For completeness, what we end up with is the following
with the alpha and beta pieces given by
My brain’s a bit fuddled at this point and I’m not seeing any simple way to analyse this ‘orrible mess. Time for some diddling with Excel.
Recall that we’re investigating a situation where drug A makes thing worse for a bit and then drug B makes it better (compared to the base rate). And we want to be (sort of) in covid vaccine territory - which is a case of drug A seemingly making things worse and then drug B (the 2nd dose) making things better (at least according to the ONS version of events.
So let’s put in some broadly comparable numbers. We’re going to go with 80% of people getting drug A and then 80% of those getting drug B. We’ll assume a base (no drugs) mortality rate of 1 in a 100 - so that’s just r = 0.01 in old money.
So we need to compare r/T with our averaged <r>/T
Let’s assume some value for the drug B modification so that b = 0.5 so that we have a 50% reduction in the base mortality rate for those who live long enough to get drug B.
Now we can plot the ratio <r>/r as a function of a - and see where things go wrong for the drugs. When this ratio is greater than 1 the averaged rate is worse than the base rate.
So, with b = 0.5, we get the plot
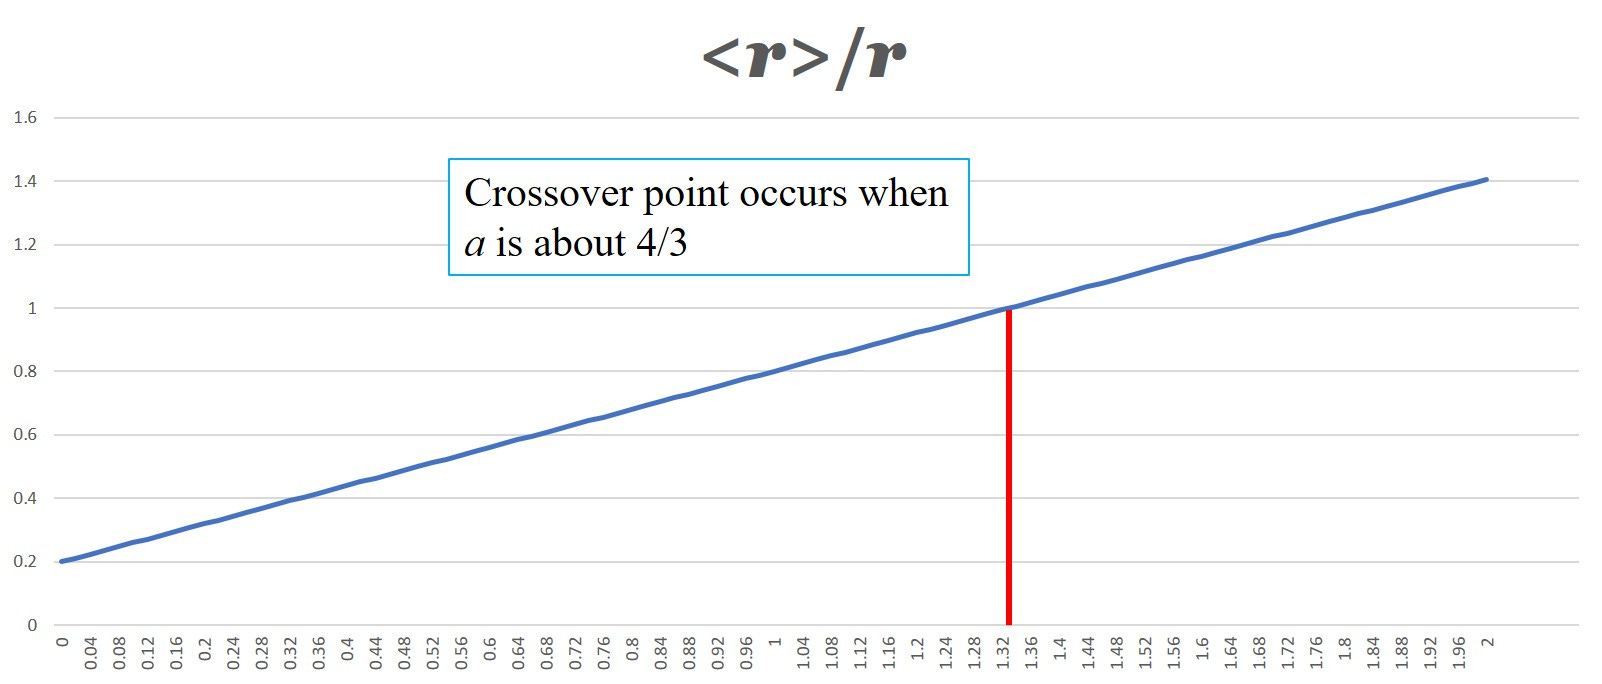
which makes some kind of sense.
The real question is whether this agrees with the “room” way of looking at things. And which is the ‘right’ way to look at this anyway?
The Room of Doom
There are (at least) two ways of looking at this.
(a) we can do as above and work out an averaged mortality rate based on person-years and make our decision based on the answer of which rates look better, or
(b) we can ask ourselves the question which choice of room gives me a better chance of survival?
I think option (b) here makes more sense. We want to know our best chance of surviving the room we’re put in - and that means working out the fraction : number who died in the room divided by number who entered the room.
But is it going to give us the same answers as option (a)?
So we have three rooms
Room C : enter this room and you’re not given any drugs at all
Room A : enter this room and you’re only given drug A after 4 months
Room B : enter this room, and if you survive your 4 months on drug A, you’re given drug B
Which one of these rooms do you want to enter?
Astute readers will have already noted that the initial 4 month period of this trial is kind of redundant. I initially wanted to include it in the analysis as a way of highlighting how the calculation of PY plays out, but it’s become a bit of a millstone for the real analysis I wanted to do - which is to get to a comparison of the different ways of combining the results from the 2 drug arms of the trial.
This kind of thing often happens when you play with a new idea like this. It’s only after playing around a bit do we realize we have been a bit of an idiot. Smarter people than me can usually avoid making so many millstones for themselves.
Using PY’s avoids this because you’re directly comparing risk exposure in each arm. The source of my current lack of intuition is all to do with how the results of the different arms get combined using the PY approach and whether this makes sense when we ask the slightly different question of which room we would want to pick for ourselves.
So let’s get rid of the millstone and assume the trial starts at the 4 month point (which we can reset to be our zero, if we like) with some population N. It’s OK that we use the same symbol here - it’s going to factor out eventually anyway.
We can make things easier by just looking at the survival probability for room C and not room C. We’re only interested in the split into drugged vs undrugged, after all.
So we split our initial cohort into 2 groups; pN go into rooms A or B, and qN go into room C (with q = 1 - p). The thing we want to calculate is the following
survival probability ~ 1 - (number dead in group/number initially in group)
The various terms like pN and qN all factor out when we do the division and we’re left with the probability estimates for survival being
Room C survival probability
Room A+B survival probability
where the f here is the fraction of those in A who are chosen for B.
Again, it’s not really immediately obvious what this is telling us and so it’s time for another round of diddling with Excel.
Here’s what you get if you plot the chart with the same splitting parameters as before and with b = 0.5. I’ve changed the fatality rate to r = 0.2 to make the chart easier to see
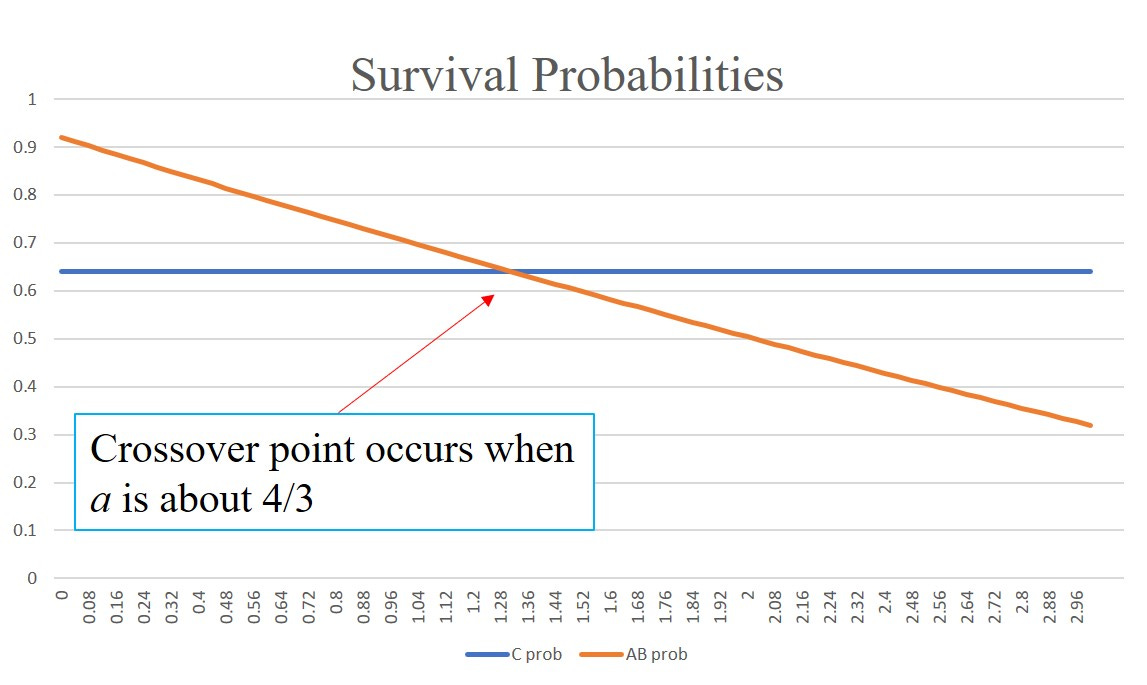
So based on this chart the PY approach and the “room” approach are giving wholly consistent answers. There’s no “funny business” going on in using PY - at least not with these choices of parameters.
The theorist part of my brain - the bit that’s still left of it anyway - wonders why when we have so different looking answers. Or do we?
Time for some head-scratching and algebra again.
From above, when we looked at PY’s we ended up with a ratio of death rates that looked like this
The R here is the rate r/T
But if we look closely at the results for the room deaths we can write
There’s clearly a relationship between the two approaches which is nice to see.
At this point I’m going to give my head a rest and cogitate more, but provisionally I now think the averaging procedure in terms of PY used by the ONS does make some sense.
TL;DR
I really don’t blame you if you’ve skipped to this point. What I’ve done is to write out the kind of process I use when trying to get to grips with an unfamiliar idea - warts and all. The danger is that I’ll look like an idiot for not having spotted obvious stuff sooner - but what we see in textbooks and the like is a finished product with all the missteps and scaffolding removed.
The aim was to try to understand the way the ONS combined their data when expressed in person-years and whether this was legitimate.
So far, it seems that is is, indeed, legitimate and I’m much less worried by the use of PY in this regard than I was a week ago.
As I was writing this Prof Fenton and Neil wrote a wonderful piece which really helps see why PY can be a very good thing to use. These guys are experts, in the old-fashioned sense of the word, but they are also expert at communicating quite difficult ideas very simply and with easy-to-follow illustrative examples.

The approach I used here was to re-phrase the question in terms of “room survivability” instead of person-years, but my initial attempt at getting to grips with this seems to indicate that the PY and “room” approach amount to much the same thing.
I hope I’ve managed to cure your insomnia. More normal, crude, adolescent, and silly humour will resume shortly.
Edit after posting : There’s a couple of things still niggling me about the analysis above. I’ve got an a floating about that I’m not sure about and I’m worried about using identical time periods when looking at person-years like this. When I’ve had a break and topped up my snark tank, I’ll return to this question.
For very high values of short
It’s easier to work out than all the symbols here suggest. If you start with a population X then at the end of the period you have X - rX = X(1 - r) left. This becomes the new start population for the next period, and at the end of this new period you’ll have X(1 - r)^2 left (just apply the formula but to the new start population for the 2nd period). This gets a bit more complicated in this case because we have to apply a splitting fraction for those who stay undrugged or go into the drug arm of the trial (which also has a different death rate).
As members of group B - they’ve already contributed to both the C and A groups.
So going back to where this started, with the ONS covid mortality data, are we all fans of the Jab of Incredible Safety and Magnificence now, if the PY thing checks out?
Very good! I think new features will turn up when you assume the population is actually stratified in a way which is not observed or measured. This is called “unmeasured heterogeneity. Suppose you can separate people into two groups. One group has some presently unknown genetic make-up which gives them a different chance of surviving the various treatments and treatment combinations to the rest of the population. We should play with this idea in your Excel framework. There is a huge statistical and epidemiological literature on this. (Many years ago I contributed to it)