
Look at the Profile on that

A fair bit of today’s article contains a discussion of stuff I’ve gone through before. It’s worth repeating, though, because probability is one of those areas most of us need to ‘practice’. I know I need to revisit the basics every now and then.
I want to look at the “2-coin” model that I talked about in the previous piece on correlation and give some examples of its use. In particular, I want to apply this to the issue of profiling - inspired by the comments of Soulbee who got me thinking about this problematic™ topic again.
Profiling is one of those political potatoes that has just come out of the oven - it’s hotter than Hades and could induce global boiling all by itself.
Should we frisk the Middle Eastern looking gentleman wearing an anorak in the middle of summer, or the attractive young woman wearing next to nothing? Well, both obviously - but for entirely different “ist” reasons!
Although it has echoes of Minority Report, the idea of profiling is that resources are targeted at those most likely to be a problem.
And there, right away, we have those bloody words “most likely”. What does that even mean?
The first thing to notice about a term like “most likely” is that it’s not innocent at all. Doesn’t it sound rather like something serious? It subtly sets up a certain expectation in the mind of the reader. Think about the phrase “you are most likely to catch covid in a crowded setting”. Stop going to those places, or allowing such crowds to form in the first place, then - they’re obviously dangerous.
But what about the phrase “you are most likely to be hit by lightning if you’re outside”?
Stop going outside?
Most of you will probably be aware that I’m touching on issues of relative vs absolute risk and how these things are communicated. But more on this later.
So, the first problem we have is that of the language used when discussing things which live in the realm of probability.
The thing about the problematic™ issue of profiling is that it is, necessarily, based on probabilistic reasoning. In order to apply this strategy one has to have some a priori basis to be able discriminate between certain groups. The question boils down, at least partly, to the legitimacy (or otherwise) of that a priori basis, but we also need to figure out whether any particular profiling strategy actually works.
Even the wokest of the woke wunderkind don’t really have an issue with profiling - the whole concept of something like Affirmative Action™ is just profiling given a fancy name for a specific application.
And Now For Some Cup Soccer
Here’s one of the all-time classic live bloopers (19s). The legendary Dickie Davis said “and now let’s look at the Cop Sucker . . .”
We know what he was really thinking, don’t we?
It’s probably a good job the next item wasn’t stunt kicking.
In order to start pinning down the issue of profiling we’re going to imagine some sporting occasion at a large stadium. We’ve got the fans of team Red and the fans of team Blue.
For some reason, the fans of team Red have been a bit naughty over the last few years and a number of them have been chucking bottles on to the pitch at the matches they’ve been to. The fans of team Blue are a bit more civilised and don’t do this nearly as often.
The problem is (something like) this:
You’re responsible for security at the stadium and you have 20 marshals at your disposal. You’re expecting 100,000 fans to turn up and you can’t search everyone’s bags. What’s the best way to use your limited resources so that you can minimize the possibility of bottle throwing?
Unless you’re a clinically insane security manager, you’d be focusing more of your resource on checking the bags of the fans of team Red, right?
You’d be doing a spot of profiling.
You’re basing this on the judgement, based on previous evidence, that the fans of team Red are “more likely” to throw bottles on to the pitch. There’s them thar probability words again. What do they mean?
But are you right to concentrate on team Red fans?
Let’s try to model this situation using the ideas from probability. We need to use these tools whenever there’s some element of uncertainty about events. That uncertainty might be arising from ignorance (if we could search all of the bags we’d be certain about those who represented a danger) and in a classical world where the future is entirely predictable from the past, then all probability boils down to a simple matter of ignorance (if only we could know the exact conditions for that coin and how it is tossed and the various other factors - we could predict, in theory, whether we’ll get heads or tails in this classically assumed world).
To begin with we’re going to split our ‘world’ into 4 categories; Red or Blue, Bottle or No Bottle. We’ll use 1 for Red and 0 for Blue, and use the letter c to denote the variable colour. We’ll use 1 for Bottle and 0 for No Bottle and use the letter b to denote this variable.
Astute readers will note that I’ve reduced everything down to the entirely equivalent issue of biased coins with some hidden mechanism inside which can correlate the results. I’ve talked about this before.
The security manager wants to know the answers to certain probability questions so that he can set his strategy for the forthcoming game with the goal of minimizing disruption and danger.
But what are those probability questions and which are the right ones to ask?
One question we could ask would be; what’s the probability of a team Red fan having a bottle?
Here’s what this phrasing of the question means to me
Let’s take all the team Red fans and put them in a different stadium, on their own with no Blue fans anywhere in this new stadium. Let’s pick one of these Red fans at random. What’s the probability I’ve picked one with a bottle?
By specifying we’re looking at team Red fans we’ve already done (at least mentally) this kind of selection process.
Notice that this is very different from the following question.
We have Red and Blue fans in the (same) stadium. I pick one at random. What’s the probability that I have picked a Red fan who has a bottle?
In terms of the variables and values that I mentioned above these probability questions are represented by two different kinds of probability distributions.
We’d write the first one1 like this; P(b=1|c=1)
which means : the probability that the person has a bottle given that they are a fan of team Red
The second probability2 is written as P(b=1, c=1)
which means : the probability that the person has a bottle and is a fan of team Red.
You can keep the distinction between the two very clear if you think about the selection process. In the first case we carted off all the Red fans to a separate stadium and looked just at this group (at least in our minds). In the second case we kept them all in the same stadium and looked at both groups.
I’ve written about this distinction several times before, but it’s really worth repeating and getting very clear in our minds.
This simple “two coin” model finds application in all sorts of places. You can reduce the whole question of covid testing, for example, to this kind of model - and by so doing you can understand why mass asymptomatic testing in times of low prevalence is a really, really dumb idea.
You’ll also notice that I’ve been careful to talk about probability in terms of picking something at random from a specified group. When we’re using these (frequentist) ideas of probability it’s really important to also keep this in mind.
The issue here is that it’s not always clear what probability we should be looking at. Do we compare P(b,c) for the two values of c, or do we compare P(b|c) for the two values of c? And are either of these any use to the security manager when deciding what his strategy should be?
The Full Monty
So, what probabilities are we talking about? The full list for this “2-coin” model is not very long.
P(b,c) : this is the probability for bottle AND team colour. There’s no selection of any subset; we’re considering the entire population we have. It refers to picking someone at random from the stadium and asking a question like “what’s the probability that the person I’ve just picked is both a Red fan AND a bottle carrier?”
P(b) : this is called a marginal probability. It is the probability that in our stadium with both sets of fans, if we pick someone at random, we have picked someone with a bottle (irrespective of which team they support).
P(c) : the other marginal probability we can have. This is the probability that in our stadium containing both sets of fans, when picking one at random, we have selected a Red (or Blue) fan - irrespective of whether they have a bottle or not.
P(b|c) : the conditional probability that if we have carted off the fans of one specific team to another stadium, and then picked one at random, this person will have a bottle (or not).
P(c|b) : the conditional probability that if I’ve (somehow) managed to isolate all the bottle carriers in one place, and then picked one at random, I will pick a fan of a certain team.
And that’s it for our simple 2 (binary) variable model. This is the full list of the probabilities we can construct from the data. We have 2 things of interest (our ‘variables’) and each of those can take the value 0 or 1 (binary).
If only life were this simple - even journalists might stand a chance of getting things right. However, in a lot of practical cases, and certainly when we’re trying to describe the dynamics and behaviours of something as complex as a society - we’re going to have a lot more (potential) variables of interest than just 2.
If we introduced another variable of ‘interest’ into our initial model - let’s just say a for age perhaps (it doesn’t really matter what we introduce here), then our “complete” probability picture is given by the distribution P(a,b,c). But now we have a lot more possible probabilities (which each represent different probability ‘questions’) that follow on from this.
We can have P(a,b) or P(b,c) or P(a,c) or P(a|b,c) or P(a,b|c) or P(c|a,b) or P(a,c|b) and so on. All of a sudden we’ve gone from “relatively simple” with our 2 variable model to journalists having to more or less make it up as they go along (which they’re really bloody good at).
By the time you’ve got to 4 or 5 variables of interest you’re in a nightmare of combinatorics and permutations trying to even write down a full list of all the possible probabilities involved, and that’s before you start even beginning the process of figuring out which probability question each one is asking. And it’s not all that difficult to think of potential variables of interest; race, employment status, wealth, sex, age, family background, education, location, . . .
When people talk of multivariate problems with regards to the analysis of social issues, this is precisely the kind of thing they’re talking about. When people talk of bias they’re meaning that one (or more) of these potentially relevant variables has been overlooked.
A (Vaccinated) Diversion
This simple 2-variable binary model also crops up again when we look at vaccine trials and calculated efficacy.
Here we have the variables vaccine jab status, j, which is either going to be 1 (vaxxed) or 0 (unvaxxed), and symptoms, s, which is either going to be 1 (sick as a parrot, or maybe just a sniffle or two) or 0 (symptom free).
The efficacy is a measure that is the fractional (or percentage) change in a quantity.
In terms of a vaccine trial we’d look at the difference between the unvaxxed and vaxxed deaths and divide it by the vaxxed deaths which would measure efficacy against death. Or we could do the same kind of thing to measure efficacy against symptoms.
To account for differences in population size (there might be a different number of vaxxed vs unvaxxed in the trial) we have to use a rate rather than the total number. If we let r stand for rate and s for symptoms, with u and v being unvaxxed and vaxxed3, we’d need to calculate the following quantity
When the vaccine trials announced a 95% efficacy against symptoms, this is what was being calculated from the data. They found (or at least claimed to find) that the efficacy here was 0.95 (which is the fractional version of 95%). If we use little n to denote a subpopulation and big N to denote the total trial population, then the rates can be written, for example, as
where I’ve used the technical device of multiplying by 1 (N divided by N equals 1) and used the fact that probability can be thought of as a ratio of number of things of interest divided by total number of things4 (using a frequentist approach).
Or I could have written down (straight away) the following
but I wanted to show how the different probabilities we can have for this 2-variable problem are connected.
Now we can write the efficacy in terms of probabilities and we have
That top bit, the numerator, is what’s known as the Absolute Risk Reduction (ARR) - it’s the absolute difference in risk (probability) of symptoms between unvaxxed and vaxxed.
The efficacy is a measure of Relative Risk Reduction (RRR).
And so we really have the following relation between the ARR and the RRR. The RRR, as its name implies, is just measuring the relative fractional (or percentage) change in the absolute risk
You have to be a bit careful interpreting this last equation because the ARR and this denominator are not independent. As the denominator goes towards zero, then so does the ARR.
We actually need both of these things (the ARR and the RRR) to properly figure out a course of action. The denominator bit could be described as a seriousness parameter - it’s telling us what level of risk we’re facing if we do nothing. What’s the level of threat we’re facing?
The RRR is telling us whether our proposed solution is any good or not compared to doing nothing. The ARR is telling us whether it’s a sensible thing to do given the absolute level of risk that is faced.
The way to think about this is to imagine a rubber suit that is 95% effective against death by lightning strikes. It works very well IF you are struck by lightning. But the seriousness parameter and the ARR will tell us whether we should be wearing one all the time.
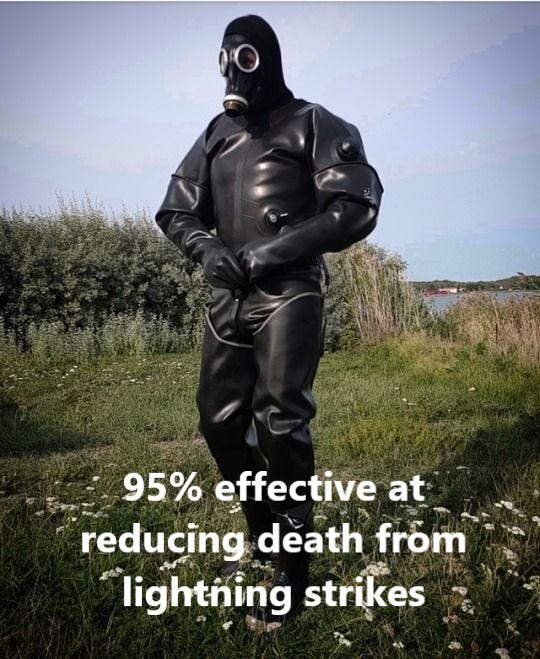
If there was a 20% chance of being struck by lightning every time you stepped outside then it’s probably a good idea to wear one of these things. If you’re talking about risks at the level of one in a million, then maybe the rubber suit is a bit of a safety overkill.
Another analogy that might be useful is to think of an item on sale. You can use this idea of fractional relative change in something here, too. When you say there’s a 70% reduction in price this is nothing more than a sales “efficacy” figure. But if the item in question has gone down in price from 10 cents to 3 cents (a 70% reduction) then you’re not exactly going to have your shop swamped with customers.
I don’t really want to say too much more here at this point - except to mention the ‘trick’ that was played. The vaccine trials were designed to test efficacy against (mild) symptoms. This is, indeed, a proxy for death - if you don’t get symptoms then, let’s face it, you’re probably not going to keel over. But it’s not a very good proxy for death when the IFR is very low.
You can convince people to get jabbed if you firmly plant a strong association between getting covid and death in people’s minds - which is precisely what they did.
To add insult to injury here, they also employed the “guilt trip” tactic - you get jabbed to protect others. It’s a bit bonkers even on its own “merits” because, as we have been screaming from the start, why do people who have already been jabbed need the unjabbed to get jabbed to protect them? That’s what the effing vaccine is supposed to do in the first place!
But it’s even worse than this because the trials were never set up to measure whether they had any efficacy against transmission - this was just an assumption, which later turned out to be false. It’s not an unreasonable assumption to make - no symptoms ought to mean no active infection and it’s still not clear to me how someone can be protected against even mild symptoms and yet still be generating enough virions to infect others - which calls into question the whole “symptom efficacy” understanding.
Testing, Testing, one, two, three
A very quick aside here. I just wanted to note that this “2-coin” model is also the one we need to describe medical testing. We have two variables which are:
test result: 1 or 0
disease: 1 or 0
The probabilities involved get given fancy names like specificity and sensitivity in this case - but it’s all the same mathematical model just applied to a different situation.
The sensitivity of a test, for example, is the probability that you get a positive result (variable ‘test’ with value 1) given you have the disease (variable ‘disease’ with value 1).
You get further technical confuseration5 when people talk about type I and type II errors, and so on. But it’s really all the same stuff as team Red vs team Blue and their penchant for throwing bottles. Same maths - just different verbiage thrown around about it.
Is He Ever Going to Answer the Bloody Question?
You’ve probably noticed that I didn’t actually answer the question I seemed to set out to ask. Which probability should the stadium’s security manager be looking at?
Let’s (sort of) do that now by plugging in some numbers.
We’ll set things so that Red team fans are a whole five times more likely to take a bottle into the stadium than the Blue team fans. Seems like a cut and dried case? Check those Red buggers to kingdom come. But hold my, erm, beer because surely it’s a bit more complicated than that?
Rather than write the numbers in a hypothetical example all out as a list, it’s a bit more convenient to have a figure to look at.

You can now see, with this hypothetical example, what the issues are here. The Blue fans, because there’s a lot more of them, have more bottles in total than the Red fans. If you focus only on the Red fans, then isn’t that going to be a bad idea? You’ll have 1,800 bottles getting through your security.
Yes, the fans of team Red are 5 times more likely to have a bottle than team Blue fans (10% of team Red fans have a bottle whereas only 2% of team Blue fans have a bottle), but if your goal is to minimize the total number of bottles that get through your search procedure, then just focusing entirely on team Red fans is probably not going to achieve that. At least that’s what it looks like, doesn’t it?
It would seem that, in other words, you probably need a profiling strategy that is mixed in some sense.
Here’s some initial thoughts we might have. You’ll get a better search hit rate by searching team Red fans, but just focusing entirely on team Red probably won’t achieve your goal of minimizing the number of bottles that get through. It’s an interesting question. I’ll look at some specific numbers in a bit, because the answer (for this scenario) might surprise you, as it did me, based on these initial thoughts.
I realize as I’m writing this that I don’t actually properly know how to do this kind of optimization in general. I have some ideas on how to proceed in the general case, but it’s not a calculation I’ve ever had to do before. I had better do some of that research stuff that non-experts are encouraged not to do6. But, thankfully, it turns out that for this specific goal of the security manager it’s not too difficult to examine and doesn’t really require any fancy analysis of probability.
The basic question is something like the following.
If you can only check 10% of the people who come through the gates (a total of 10,000 checks), then what proportion of Red vs Blue checks do you need to do to minimize the number of bottles that get through?
The problem here is one of relative population size. If we had equal numbers of Red and Blue turning up to the game then it looks like you’re going to be better off focusing7 on the Red fans rather than just adopting a strategy that checks Red and Blue with equal probability.
In this situation (equal numbers of fans for each team) a profiling strategy that discriminates against Red makes sense. Not doing such profiling would lead to a worse outcome.
If you’re against any kind of profiling at all then your strategy is already pre-determined. You select people to check uniformly at random (no discrimination). This will not, in general, lead to a minimization of the number of bottles that get through if there’s a mismatch between the likelihood of bottle carrying between the Red and Blue.
Some Surprising Numbers?
Let’s just work out a couple of the probabilities from the given example numbers, and let’s see how various profiling strategies play out.
The probability that picking someone from the crowd, entirely at random, results in the selection of Red and bottle is
The probability of selecting a Blue fan with a bottle is
If you compared just these two probabilities then you might (erroneously) write that Blue are more likely to be bottle carriers than Red.
If you stopped 10% of the fans of each team (on average) then you’d collect a total of 280 bottles on average. This is a non-discriminatory policy - no profiling at all.
This requires 10,000 checks to be performed (1,000 Red checks and 9,000 Blue checks).
If you stopped 5% of the Red fans and 15% of the blue fans then you’d collect a total of 320 bottles on average.
This, however, requires 14,000 checks to be performed.
So let’s stick to 10,000 checks (our assumed upper limit on the number of tests that can be carried out) and assume that you check a quarter of all Red fans.
You’re now checking 2,500 Red fans (25% of them) and 7,500 Blue fans (8.33% of them). You are discriminating against Red - you’re ‘testing’ a higher percentage of them. Now you’re going to collect 400 bottles.
What about the limits here?
If you can do 10,000 checks and so you ‘test’ all of the Red fans, then you will collect 1,000 bottles. This is 100% testing of the Reds (a “Reddist” testing strategy).
If you can do 10,000 checks and you only test Blue fans then you’re going to be testing 10,000/90,000 of them which is about 11%. In this case you’re going to collect only 200 bottles (on average).
What about a strategy that tests Red with a 5 times greater likelihood? They are, after all, 5 times more naughty than Blue.
Of the 10,000 tests we can do, then, we’re going to be testing about 8,333 (about 83% of them) Reds and 1,667 Blues (about 1.85% of them). This will net us a total of about 867 bottles, on average.
For this specific example, our Reddist nature (complete discrimination against the Reds) actually paid off. Despite the Blues having more bottles in total, with limited resources, it looks like we’re better off ignoring the Blue fans completely - with these specific numbers.
In other words, for this example, being totally biased against team Red fans looks like it might be the optimal strategy here. It’s really not looking good for the “politically correct” position of no profiling at all.
The little squiggle goblin inside me is starting to prod me. What do the squiggles (the maths) tell us?
It’s a Goal
One side effect of learning complicated stuff like maths and physics is that you sometimes get a bit bamboozled into thinking too big. You have something you want to analyse and start off by thinking about all of the potential complexities involved. You begin to salivate over all of the fancy techniques you can bring to bear. After a while, you realise you’ve been a bit of a berk and that the problem solution is really quite simple. It happens the other way too - you can easily make something too simple to begin with.
Remember that for the security manager the goal is to minimize the number of bottles that get through the security cordon - or, equivalently, to maximise the number that are collected by the cordon. A sensible place to start, therefore, is to write down the equation that tells us how many bottles are collected.
Once you do this, you kind of shuffle into the corner with a shamefaced expression because you’ve just spent what seems like days discussing all sorts of issues with probability and how various different ones are to be interpreted.
Here’s the equation for the number of bottles that are collected (on average)
the F and G here are the number of tests that are done on the Red and Blue fans, respectively, and we have the condition that F + G = 10,000 in our specific example (although we should let this be general so that F + G = M, say, with M being the number of security checks we can do).
Let’s just put in the numbers we have, to clarify this equation a bit. For the example where we’re testing 25% of the Red fans we would have F = 2,500 and G = 7,500 with P(b=1|c=1) = 0.1 and P(b=1|c=0) = 0.02
So for the number of Red fan bottles we collect it’s just the number of Red fans tested times the probability that a Red fan has a bottle.
In terms of the selection process I talked about above, what we’ve done (at least mentally) is to cart off all the Reds to another stadium and just picked 2,500 of them at random. Obviously, the actual number of bottles you manage to find is going to vary each time you do this, but on average you’ll find 250.
We can refine this bottles collected equation a bit. We’re going to let d stand for a discrimination parameter that varies between 0 and 1. When it’s zero, you’re testing all Blue, and when it’s 1 you’re testing all Red8. We’re also going to let q be a parameter that tells how much more likely Red fans are to have a bottle. In our example above we have q = 5.
With M being the number of tests we can perform, the number of bottles collected on average now becomes (after a little algebra)
The thing in the square bracket is what we need to focus on. The only thing that isn’t fixed here is this d - this represents our profiling strategy. The q and P are fixed (previous observations give us these estimates) and the M is fixed (it’s the number of tests we can actually do).
I should also mention that we’re also assuming that M is less than or equal to the number of fans of any one kind.
My initial thinking about some kind of mixed strategy was wrong. When Red fans are more likely than Blue fans to have bottles (the q parameter greater than 1) we’re going to maximise the number of collected bottles by choosing d = 1.
To collect the maximum possible number of bottles we need to only check the Red fans.
Ouch.
Where Does This Leave Us?
Before we go all a bit KKK and start advocating that black people shouldn’t be allowed to walk down the streets without being accosted by the cops we remind ourselves of a couple of very important things.
This sports event scenario is a very simple (and specific) situation in which a “2-coin” model makes some sense - but even with this you’d want to bring in other variables. Although we should try not to be too sexist and ageist about things, it’s probably not going to be all that productive to check the handbags of any 87-year old granny (who, miraculously, managed to avoid the Certain Doom™ of covid) who turns up to the game.
We also assumed we had good quality evidence from prior games that Red fans were more likely to bring a bottle.
We can’t just lift this analysis naively and apply it to crime stats. One thing (amongst others), for example, that is often overlooked is the frequency of criminal behaviour for a given individual. It is entirely possible to have a small subset of very frequent offenders that make the group as a whole look really bad - in fact, the rest of the group may be (on average) more law abiding than some comparator population. The corresponding thing for the bottle scenario is the implicit assumption that has been made that each fan brings either one bottle or none at all.
But I found it a fascinating exercise for this limited scenario of bottles at sporting events and was quite surprised by the result. It showed a couple of things:
(a) to achieve the specific goal of minimizing the number of bottles that get through, then a profiling strategy is entirely rational and the right thing to do
(b) not only that, but profiling with extreme prejudice is actually the optimal strategy
And we can now answer the question we asked. The only probability that turns out to be relevant if you’re wanting to minimize the number of bottles that get thrown onto the pitch is the conditional probability.
This kind of probability is known as a conditional probability. We can think of this as a kind of “focused” probability - we’re zooming in on a subset of interest - in this case the Red fans.
This is known as the joint probability and it’s the “complete” picture of all the variables we have in our model. We’re not trying to “focus” on any one particular aspect.
Unvaxxed labelled as “u” here is just the same as having j = 0 for the jab status - it’s a moot point whether using u and v in the rate here helps to clarify things or not.
To (experimentally) determine the probability of getting a 2 or a 3 on a dice roll, you could roll the dice 1,000 times and count the number of times you got a 2 or a 3. The probability would then be approximately equal to this counted number divided by 1,000.
This is technically known as beating around the G.W. Bush
Now that I’ve asked this question, which surely must have been answered before, it’s going to niggle me until I’ve either figured it out for myself, or looked at some textbook. I’m sure it will have been covered in that chapter on sampling that I read once, but have now completely forgotten about!
For the case where we have equal numbers of fans with Red 5 times more naughty than Blue, in order to minimize the number of bottles getting through, the initial thought here is that we’re going to have to adopt a biasing strategy to be somewhere between 50% (uniformly at random and therefore no discrimination) and 100% (total discrimination against Red - no Blue fans checked).
The “no profiling” condition is that the same percentage (relative to their respective populations) is tested. This is not the same as setting d = 0.5 (unless you have equal populations of Red and Blue).
If I lived to be one hundred, I still wouldn't be able to think this logically and deal with probabilities....but I am so grateful some of my fellow human beings have this aptitude :-)
You can also permanently ban Red or Blue fans who has ever been caught with a bottle. Furthermore, you can make it so Team Red and Blue resp. has to pay a fine every time a Red or Blue is caught with a bottle.
Plus, the cost/benefit-ratio isn't fixed as such - the cost of stopping a game, removing bottles/shards, injured Red/Blue fans, injured wardens, and so on must be weighed against the cost of arranging security to maximise the number of bottles found.
Look at border control: when visas, travel bans and border security/customs were the standard, criminals couldn't travel, smuggle or do much of anything - they certainly couldn't move and migrate with impunity! - and the cost of border control et c was more than covered by all the rapes, murders, robberies, lootings and so on that didn't happen.
Or even simpler: I can either have good bins for chicken feed, a well-built coop that's proof against any predator smaller than a bear, and traps for mice - or I lose chickens and eggs and feed to scavengers and predators.
Guess which one is more humane and has the better cost/benefit-result?
Yes, it has to do with probability - the odds of any fox finding my coop are near 100% given that foxes are canines and track by scent. The odds of the fox getting a chicken can be made virtually 0%, if I want to.
It's the same with "Team Red" and "Team Blue". Just as with mRNA-injections and myo/pericarditis, just check before and after, ceterus paribus. Or border control. Or virtually zero migration from groups with high probability for unwanted behaviours. Or...
It's not as if this is hard or difficult. Our ancestors managed it for about 8 000 years or so.