
Pfiddling while Rome burns


A while back, the magnificent Metatron published the following piece :

I didn’t quite twig just how important this piece was until I decided to do some more diddling and fiddling with the squiggles. This chart is the key piece for today.
What you’re seeing here is that over 50% of listed covid deaths in the vaccinated occur within 14 days of getting the Goo (at least in Alberta).
You what?
Precisely.
I doubt whether Alberta represents some freakish special case - so let’s run with this and see what it implies for the calculations of vaccine ‘efficacy’. In particular, I want to focus on the commonly-used (innocently or otherwise) ways of fiddling the result.
I’m not too interested in extreme accuracy and precision (although I will do my best). What I am interested in is trying to assess the following question
If ignoring vax deaths or, even worse, attributing a vaxxed death as an “unvaxxed” death is an issue - then just how big of an issue is it?
In order to get some insight I’m going to really simplify things and consider just a single vaccine dose. I’m also going to consider that on day 1 everyone who is going to get jabbed does so. That would be an optimum thing if the vaccine worked, right? You’d want everyone who wanted the stuff to get jabbed as soon as possible.
We then have the following picture
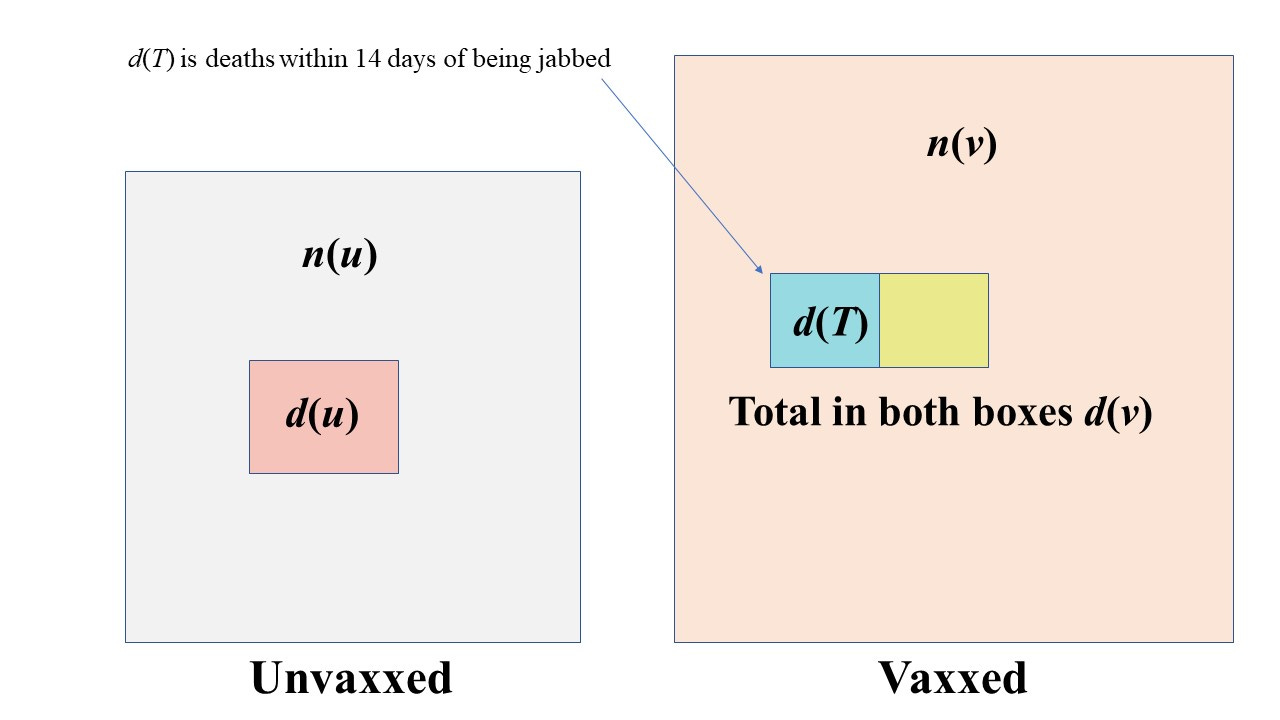
So, we jab n(v) people on day 1 and then see what happens. Some time later we’ve had a total of d(v) deaths in the jabbed group. Of those we’ve had d(T) occurring within 14 days. We can relate the 2 with a ‘goo factor’ g so that
d(T) = g d(v)
In the Alberta case our goo factor would be 0.556
Now let’s figure out the efficacy. The standard formula for this is e = 1 - X where X is the ratio of death rates (death rate in vaxxed divided by death rate in unvaxxed).
The death rate is just the number dead divided by total population.
We’ve all seen this formula before I think. This is what I would call the ‘true’ efficacy. We’d look at the stats at the end of our process (so maybe after 4 months, for example). We’d have a death rate in the unvaxxed of r(u) = d(u) / n(u) and similarly for the vaxxed - and then work out the efficacy based on these.
What we’re interested in is whether the process of getting injected with some goo has made things better or worse.
This does not appear to be the same question the Experts™ want to answer.
And so we come to diddle number 1
Diddle 1 : ignoring d(T)
The argument here runs along the following lines
The vax only kicks in after 14 days and so in order to assess whether it confers any benefit we need to consider deaths in the vaxxed after this period and compare those with deaths in the unvaxxed
It sounds oh so reasonable on the surface doesn’t it? Those silver-tongued Pfolk in white coats know what they’re doing! They sure do. But what they’re doing is deceiving you. Let’s see why, and in the process we’ll also see why getting an ‘efficacy’ using this methodology is really dumb.
With this first-stage fiddle the people who died from covid within 14 days of getting jabbed are just going to be ignored completely. Now we’re not going to do the correct thing of reducing the ‘vaxxed’ numbers by this death toll - because we can reasonably suppose it is a small fraction of n(v), the number vaccinated (this is consistent with death rates of less than 1% which is the case). This represents an additional fiddle - but one which has only a very small impact.
So we have some new efficacy that differs from the true efficacy - and we’ll use a dash to denote the fiddled version of efficacy. The fiddled efficacy is then
e' = 1 - r'(v) / r(u)
But the new, fiddled, death rate is r'(v) = (1 - g) r(v)
which after a smidgeon of algebra means that we can write the diddled efficacy as
e' = (1 - g) e + g
This is a very interesting result. It means that if g = 0.5 which is consistent with the Alberta data, and the true efficacy is not negative, then the diddled efficacy cannot be lower than 0.5!!!
If you have legislation that says a vaccine must meet a requirement of 50% efficacy then, even if the true efficacy was zero, this vaccine would meet this requirement.
As another example, suppose we had 50% dying within 14 days, as in Alberta, and the true efficacy using the non-diddled data was found to be 25% we would find our new, all-improved, washes whiter than white, diddled efficacy to be 62.5%
Now let’s see why using this diddle is dumb.
Let’s suppose (for simplification) we had some disease that killed, if was going to, within 14 days. We’re going give out a ‘vaccine’ on day 1, as above. However, the ‘vaccine’ is just a shot of the infectious agent. So on day 1 we give the disease to all of those people lining up for the shot.
What is the true efficacy of this procedure? Obviously, it’s zero. All we’re doing is to compress those deaths that would have occurred as a result of natural infection into a 14 day window.
However if we use diddle method number 1 we can simply discount everyone who died - because they died within 14 days.
Our diddled efficacy would tell us that our procedure was 100% effective.
All you’ve actually done with this procedure is to muck around with the time-progression of the disease in the jabbed cohort. All of your supposed ‘efficacy’ using this diddle methodology is an example of survivorship bias. It’s essentially claiming natural immunity as a win for the vaccine.
Diddle 2 : Adding the vaxxed deaths to the unvaxxed total
With this fiddlesome procedure we’re going one step further and not just ignoring the deaths but adding them to the category of unvaxxed deaths.
We have the same r'(v) as before, but now our unvaxxed death rate is increased so that
r'(u) = [ d(u) + g d(v) ] / n(u)
and we’ve used the same approximation as before because adding this death total to n(u) to increase the number of people classed as unvaccinated doesn’t make much difference.
I’m not going to write down the general formula here, or give its derivation - it’s mostly just tedious algebra anyway. The diddle 2 efficacy is a function of the true efficacy, the goo factor, and the percentage vaxxed. Interestingly, the more you vax the better the diddled efficacy looks irrespective of the actual true efficacy. This fact alone should be setting off all sorts of alarm bells ringing.
According to this diddled efficacy, simply increasing the vax percentage improves the efficacy. What a joyous ruse - a Pfiendish Pfiddle.
One specific instance of this formula for when g = 0.5 (the Alberta data) and we have 2/3 of the population vaxxed (also not too far off the truth for many places) is
e' = 1 - 0.5 (1 - e)/(2 - e)
So we can now compare the true efficacy with efficacy diddles 1 and 2 - all plotted as a function of the true efficacy). If that seems weird - the true efficacy plotted as a function of itself is just a straight line like y = x.

The vertical dashed line here is indicating a true vax efficiency (using the non-diddled data) of about 25%
At this true efficacy of 25% , diddle 1 gives an efficacy of 62.5% and diddle 2 gives an efficacy of nearly 80%
And there you have it
The only conclusion one can draw is that the various fiddly diddly stuff that has gone on with the covid data has resulted in a very inflated figure of vaccine efficacy. The statistical shenanigans of either ignoring certain deaths, or putting them into the wrong category, is not a minor effect at all.
*caveat : I have rushed things a bit this morning - and am already running late - so it’s possible I have miscalculated. However, the algebra passes a few simple tests (like does it give the right result when you set g = 0, for example?)
EGM covered this phenomenon about a year ago, though you each worked it a little differently. They refer to the t<=14 period as the "running to the bunker" period and illustrate how starkly the situation is misrepresented when deaths in this interval are lumped into the "foxhole" condition when it was the "ordered to run from the foxhole to the bunker" condition that made the deaths possible in the first place.
The numbers have made it very clear for a while now that the 14-day window is MUCH higher risk with a MUCH more vulnerable immune system than the states before or after.
This probably relates to the elimination of "old guard" antigens while antigenic fixation is getting established by the goo.
What no one smarter than me has the data to play with yet is whether each subsequent booster is causing the same roll of the dice or whether it's simply causing direct harm through myocarditis & friends.
I should add that I sometimes try to use a simplified, less mathy example to show people that the datacrime you're describing works even if both the control group and the Goo group get saline solution. Then suppose that half of all adverse events occur in the first two weeks (which is not unreasonable if I understand the data at openvaers correctly). Finally, suppose that the Goo group is considered un-Goo'd during those first two weeks. Then a quarter of all adverse events get moved to control group, so that they now have 3/4 of all adverse events, and the Goo'd group has 1/4, so the Goo looks super-safe.