How to Eff-Up your Efficacy
You’ve all seen the stats and the claims - didn’t Prof Joe Brandon recently say that if you’re Goo-free you’re something like 97 times more likely to die of covid than the Goo-Goo’ed and boosted? I probably need to be ‘fact-checked’ on this, but lots of people make similar claims for Goo efficacy.
I think he was referring to charts from Our World in Data that look like this
Here the data for Switzerland seems to indicate you’re 48 times more likely to die if you’re Goo-free. This is praise indeed, for the Goo. Yet when you look at worldwide covid mortality data we don’t seem to be seeing anything like this high claimed efficacy.
Here’s a comparison of China, Israel and the UK
Didn’t China do well? No covid deaths since April 2020, without mRNA vaccines. I couldn’t possibly comment on whether CCP figures are accurate here - I attribute their great success to having removed bat from the menu.
What’s fascinating, though, is jab-happy Pfisrael. Two years of covid and consequent higher percentage of disease-acquired immunity, 4 lots of Goo, and still their covid deaths peaked higher than ever before in 2022. Hard to reconcile that with the superly-duperly efficacious Goo isn’t it?
I’m sure the pro-Goo will have ‘explanations’ on hand, but something doesn’t sit right with me here. This is not what I would expect to see after a high percentage of your population have been Goo’ed with a highly efficacious Goo - and especially not after an increased percentage of people with disease-acquired immunity after two years’ worth of exposure.
But these are murky waters - and it’s hard to trust any of the data fully. The UK’s relatively high covid death toll owes much to the absurd way in which deaths were registered, for example. And we also see similar sleights of hand with definitions of Goo’ed and Goo-free. Notice in the first chart that partially Goo’ed people have been excluded. In my view, this is a fundamental category error and I want to explain why in a bit more detail.
Things are going to get moderately technical but the TL;DR here is that :
mis-categorization can affect things quite drastically.
I’m going to phrase things in terms of probabilities (which can often be difficult to understand and sometimes counter-intuitive), but the actual calculation involved doesn’t require too much understanding of probability.
The basic question we’re asking is of the form “how much better is X than Y ?”
So if we’re shopping for our groceries and an item has been reduced from $12 to $8 we’re trying to answer the question “how big of a reduction is that?”
One way of answering that question is to take the difference 12 - 8 and to express that as a fraction of the original price. We would calculate (12 - 8)/12 which is equal to 1/3. So the item has been reduced by 1/3 (or about 33%) from its original price.
We can also do the same for price increases. Suppose the original price was $8 and it increased to $12, how much of an increase is that? In this case we do something similar and calculate (12 - 8)/8 giving us a factor of 1/2 (which is a 50% price increase).
The method is really to look at the difference between ‘new’ and ‘old’ and divide that by ‘old’.
Essentially these are exactly the same kind of calculations we do when computing vaccine efficacy.
Answering this question for the covid vaccines is fraught with difficulty - especially now we have 3 shots, and even 4 in some places. The relative populations in each group (unvaxxed, 1st dose, 2nd dose, etc) are time-dependent and we must also factor in things like age (the initial doses were rolled out in an age-dependent way, for example) and also other potential biases like health and behaviour.
Simplified Model
I want to try to simplify things a bit - to create a simplified model, so to speak - in order to get some idea of how changing definitions (i.e. mis-categorization) affects things.
I’m just going to consider 1 shot of the vaccine - and think of things in a “steady state” situation where the rollout has ended, so everyone who is going to get jabbed has been jabbed. Time-dependence will be ignored and I’m going to use probabilities. These probabilities can be thought of as a kind of ‘average’ over the period in question.
A word of caution here. Doing this properly really does require that some attention is paid to the time-dependence. As time progresses any ‘blip’ caused by limbo will become less and less significant, for example. Things like waning vaccine efficacy and prevalence also need to be accounted for. But this simple probability-based model I’m using does give us some insight into the issues with mis-categorization.
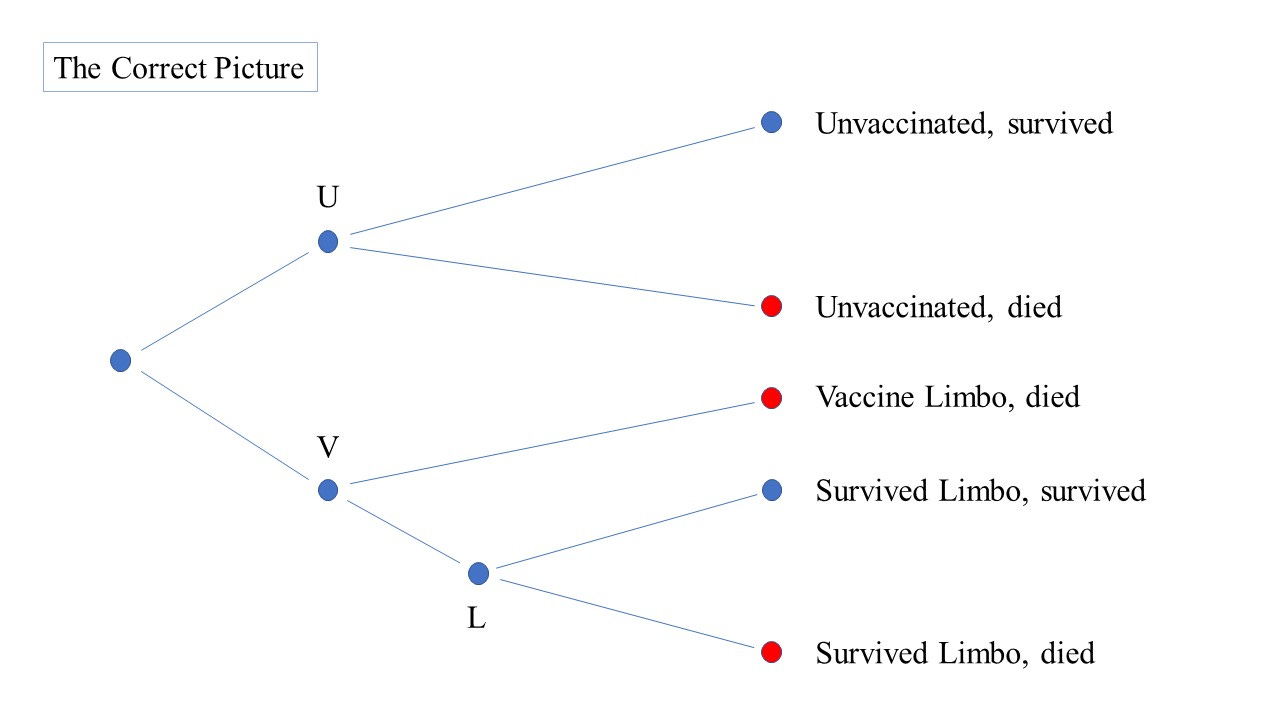
So, I’m going to be thinking of things like the probability that you die (of covid) if you are in the unvaccinated group. I’m also going to have a vaccine “limbo” period where you’ve had a jab, but are not yet considered to be “vaccinated” according to health officials. Finally, there will be a vaccinated group who have survived limbo.
One useful way to think about probabilities is to consider what’s called a “probability tree”. So you start with a ‘node’ and this splits off into two possibilities (say, jabbed and unjabbed, for example) which give us two nodes - and if there’s another choice at this point we have more ‘branches’ from these two nodes.
For this single-shot model the probability tree looks like this:
There are 5 possible outcomes we can have. Pick any person from the original population and they’re going to end up in one of these 5 outcome groups.
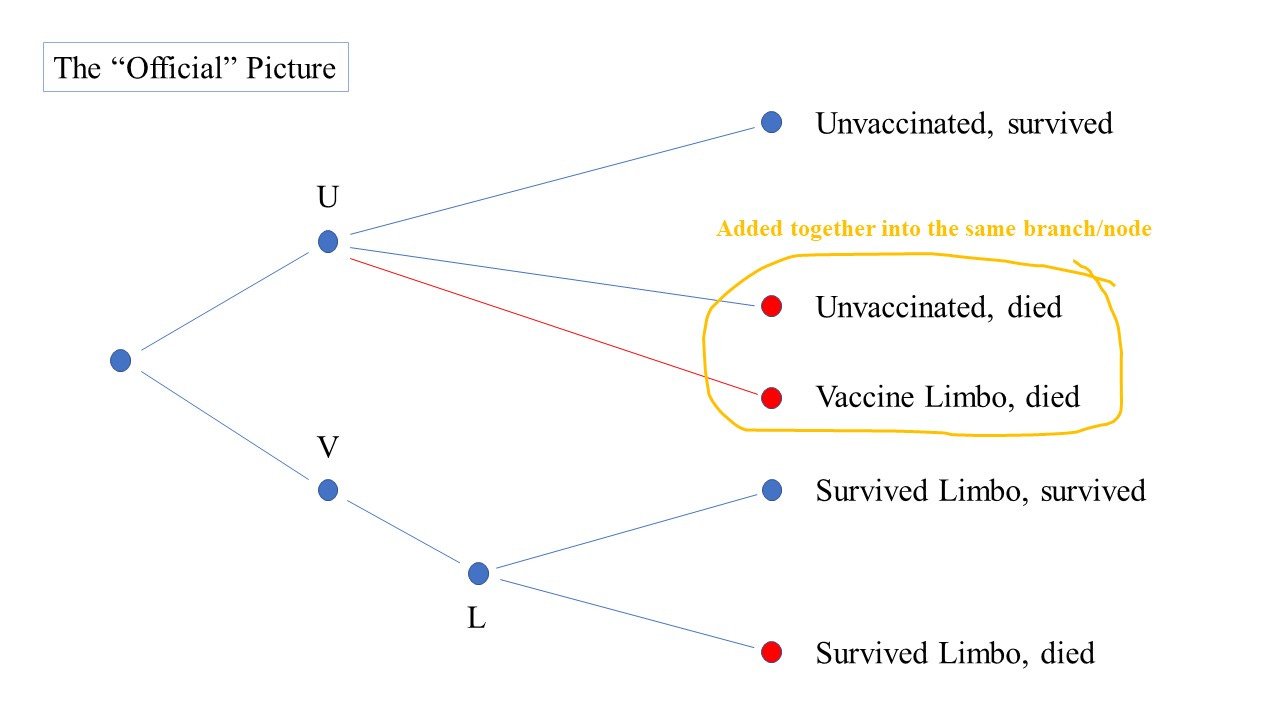
The issue is that the ‘official’ version of events is that you are not considered to be “vaccinated” until you have survived limbo. So here’s the ‘official’ version of the same tree:
You can see here how one of the branches has been moved from node V to node U. The vaccine limbo deaths just get added to the “unvaccinated, died” branch.
The question here is what is the impact of these changes when calculating vaccine efficacy?
Official bodies seem to be interested only in those who have survived limbo. As a potential vaccinee, however, you’re interested in whether getting something injected into your arm reduces your risk, and by how much.
Efficacy
So, there are going to be 2 different efficacies you can compute. The one based on the first tree I will call the ‘correct’ efficacy and label it as ε(c). The one based on the 2nd tree I will call the ‘official’ efficacy and label it as ε(o).
What we want to know is “how much better is the ‘official’ compared to the ‘correct’?”
We can apply the same reasoning as we did for the grocery shopping to get a kind of “efficacy of efficacies” - or a meta-efficacy, which I shall label E.
We’re going to calculate the initial efficacies, the official and correct versions, in terms of probabilities. There are 5 probabilities associated with the 5 possible outcomes. Since vaccine efficacy is determined by looking at death rates we only need to look at 3 of those probabilities
P(d, u) : the probability that you died and were unvaccinated
P(d, L) : the probability that you were vaccinated and died in limbo
P(d, v, s) : the probability that you died and were vaccinated and survived limbo
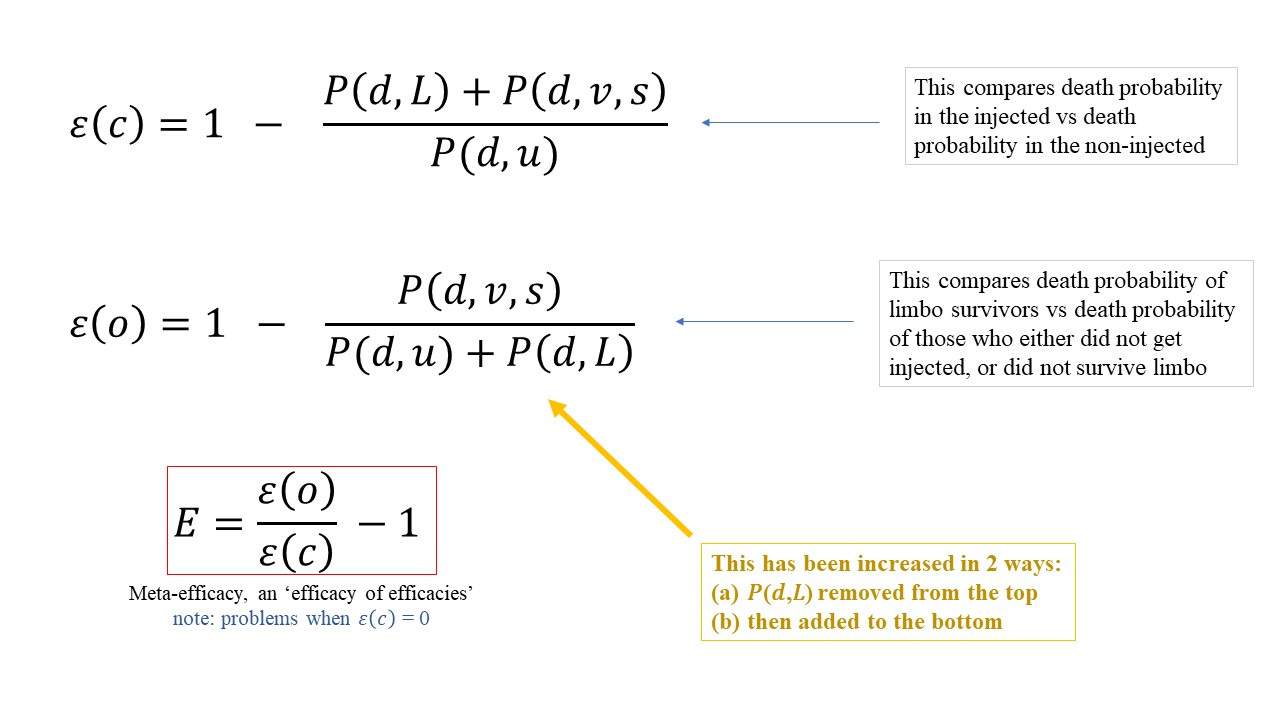
Here’s what the squiggles look like:
Translating everything into math shorthand (the squiggles) makes it all look waaaaay more complicated than it actually is - it’s mostly a visual thing, not a conceptual one. It really is just the same calculation as the grocery store example.
We can see the effect of the definitional switch in the ‘official’ efficacy. First of all you’ve taken something off the top in the fraction. So if you work out (10 + 5)/5 you get 3. If you remove the 10, the answer becomes 1. This really helps because now you’re making the efficacy bigger (you subtract a smaller number from 1). But you compound the error by sticking the thing you removed into the denominator (the bottom bit). So (10 + 5)/5 becomes 5/(10 + 5) which now equals 1/3. So you go from 3 to 1 and then to 1/3 - all the time making the number you have to subtract smaller. For our calculation this makes the ‘official’ efficacy bigger than the ‘correct’ efficacy - a double whammy.
But we want to know by how much it improves things. So, we apply the efficacy measure again to get E, the meta-efficacy.
If the meta-efficiency is 0.5 this means that our ‘official’ efficacy is a 50% improvement on our ‘correct’ efficacy.
Now we’re going to write everything in terms of the unvaccinated probability. We do this by introducing scaling parameters. So, we will write : probability of dying in limbo equals some factor times the probability of dying in the unvaccinated group. In shorthand this looks like P(d, L) = λP(d, u) so the multiplicative factor is λ. We do the same for the probability of death in the vaccinated group so that P(d, v, s) = µP(d, u).
The parameter λ here is telling us about the risk in limbo.
The parameter µ here is telling us about the risk after you’ve survived limbo.
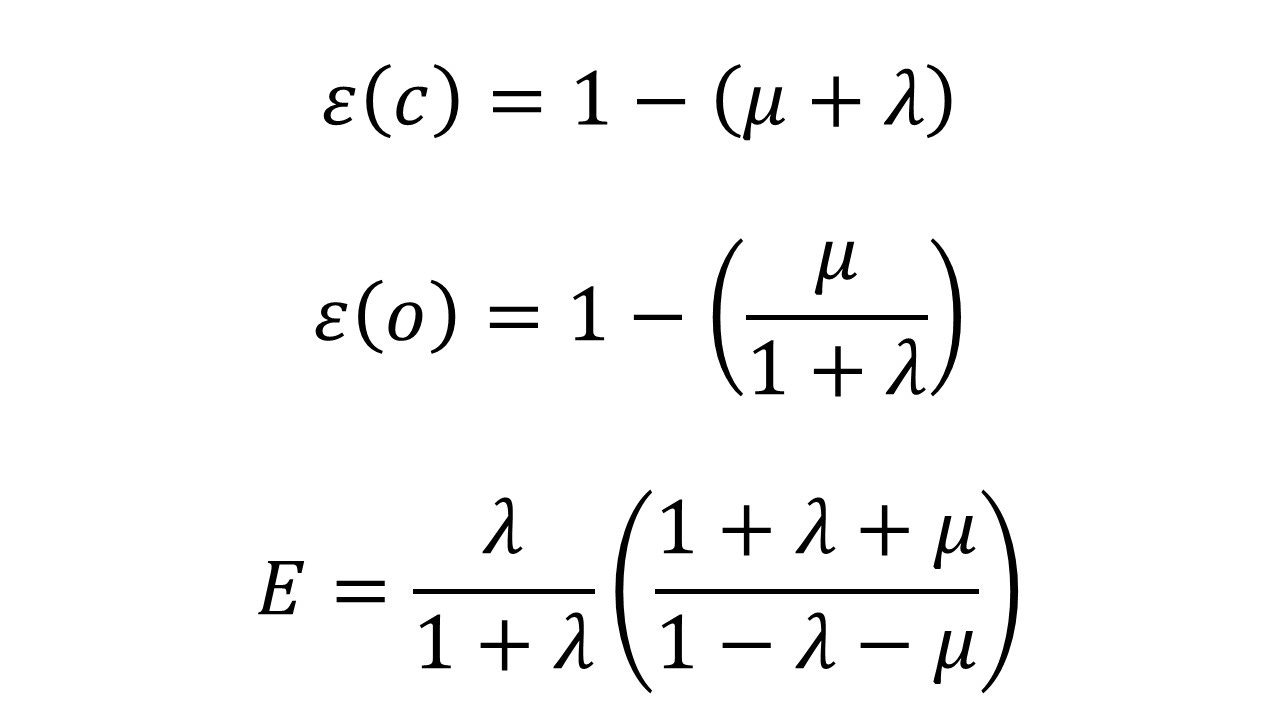
When you write everything in terms of these mu and lambda parameters here’s what you get (after a bit of algebra)
Some things to note here
the efficacies are less than or equal to 1, but can be negative
ε(o) is greater than ε(c) (or equal when λ = 0)
the meta-efficacy goes to infinity when ε(c) = 0
Let’s have a look at this last special case when ε(c) = 0
No overall efficacy : ε(c) = 0
For this to happen we have to have µ + λ = 1
What does this mean? It means that at the end of the specified period (time in limbo plus time in vaccinated group) your risk of dying from covid has not changed. You are in exactly the same position as if you hadn’t been vaccinated.
This might happen, for example, if we have λ = 0.9 and µ = 0.1
If this were to be the case the ‘official’ view would be that the vaccines are “effective”. After all, now you’re defined to be fully-vaccinated you have only one 10th the risk of dying, compared to the unvaccinated.
We might expect λ to be less than 1. Suppose we consider an 8 week period. If you get jabbed right at the start then you might have 3 weeks of limbo compared to a total of 8 weeks if you remain unjabbed. Even if the jab makes it more likely to die (per day) of covid during limbo, you’re only in limbo for a fraction of the time.
Let’s look at a special case here:
λ = 1 and µ = 0
Here the limbo period significantly increases your risk of dying of covid (it is equal to the risk if you remain vax-free for the entire period), but if you survive this limbo period the vax works brilliantly and you don’t die of covid. In this special case we would have
ε(o) = 1 but ε(c) = 0
In other words, we would have the ‘official’ efficacy being 100% and the ‘correct’ efficacy being zero. Quite a significant difference!
The General Case
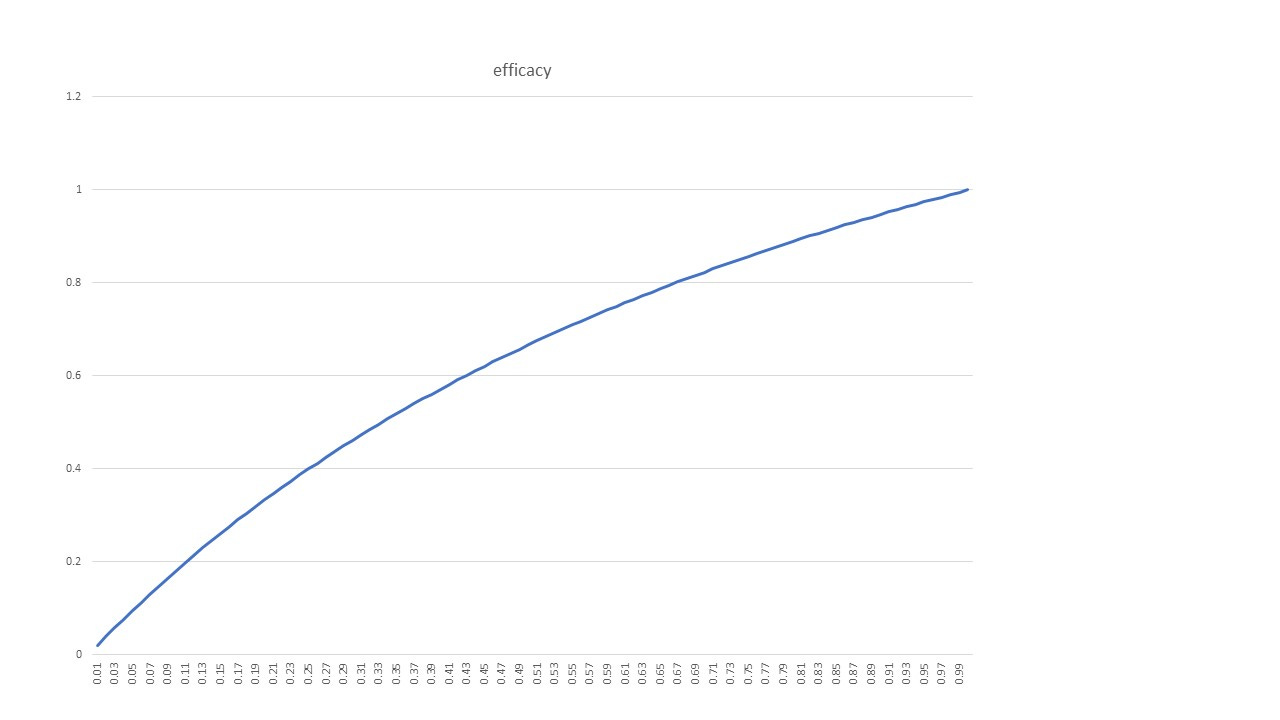
What does this look like in general? If you work out the ‘official’ efficacy when ε(c) = 0 you get ε(o) = 2λ/(1 + λ). Here’s what this curve looks like (and we note that λ can only vary between 0 and 1 in this special case condition of ε(c) = 0):
So in all cases here (except for λ = 0) the ‘official’ efficacy would be positive with the ‘correct’ efficacy being precisely zero.
The take-away here is that it’s quite possible to have zero efficacy overall (as measured by the ‘correct’ efficacy) but with a reasonably high efficacy as measured by the ‘official’ efficacy.
Mis-categorization of vaccinated vs unvaccinated with regards to covid death can have quite profound consequences. This is especially important because it is known that being in vaccine limbo elevates your risk of covid death compared to the same time period in the unvaccinated.
ε(o) - ε(c)
With a little bit of algebra it’s possible to prove that
ε(o) – ε(c) ≥ λ
which means that the difference between the official and correct versions of efficacy is at least as big as λ.
As time progresses these two measures will converge because λ is a scaling factor comparing unvaxxed risks with limbo risks.
High Claimed Efficacy
We’re going to consider the case where we compare only the vaccinated (and survived limbo) with the unvaccinated. This is what we’re seeing in the OWD chart for Switzerland above. Let’s, therefore, suppose that µ = 0.1
This means that covid deaths in the survived-limbo-vaxxed group are (proportionally) only a tenth of those in the unvaxxed group.
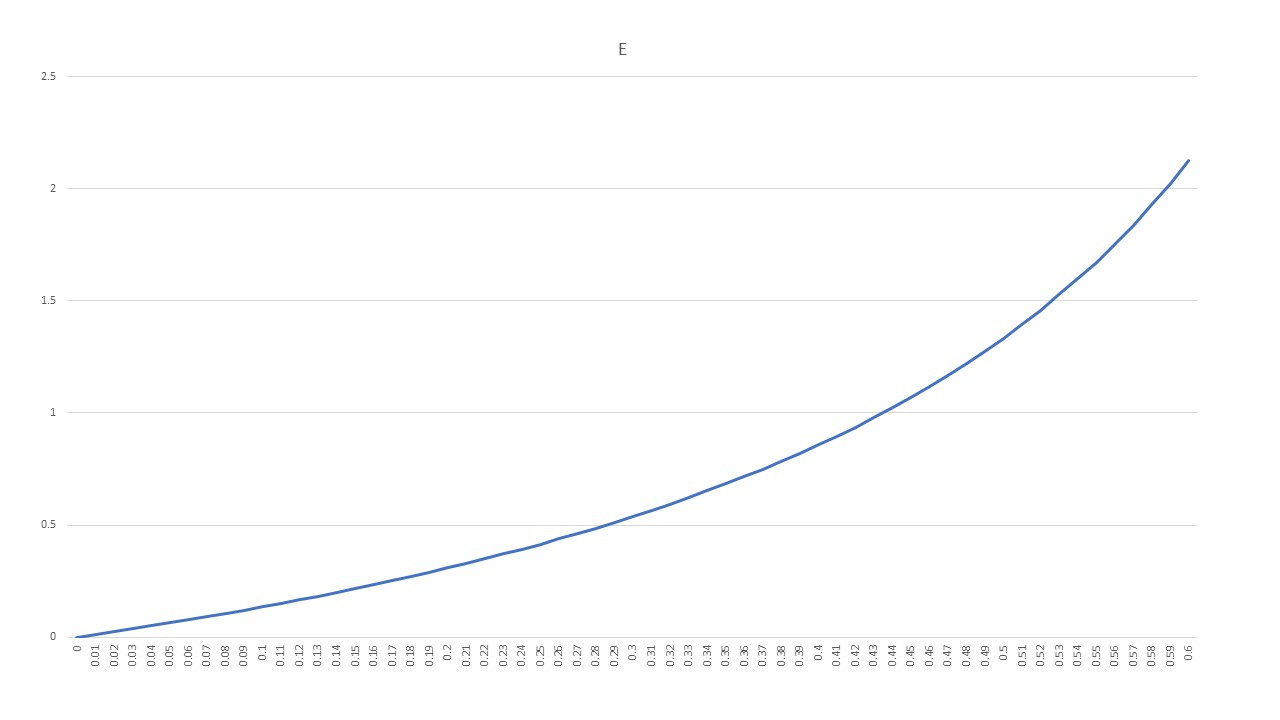
Here’s the meta-efficiency here - a measure of how much better the ‘official’ version is over the ‘correct’ version as a function of λ and with µ = 0.1
Notice that even with λ being a relatively modest 0.3 you’re getting over a 50% improvement in your ‘official’ efficacy compared to the ‘correct’ efficacy. That’s with a low value of µ - so it looks like the vax is reducing death by 90% compared to the unvaxxed, when in reality looking at overall risk the efficacy is not this high.
Summary
I apologise for the technical jiggery-pokery here. It’s something I’ve been working away on over the last few days. I really wanted to get to a point where there was a simple mathematical proof that you really can eff-up your efficacy by mis-categorization. I’m not saying anything new here - lots of people have pointed this out. I just wanted to try out a different perspective on it all.
The main take-away is that we really, really need to include the risks in vaccine limbo in any calculation of overall efficacy, because not doing so can give a hugely misleading result.


I'm going to make myself a big strong coffee and read that again. Admitedly, I got a little lost halfway. I understand, and agree with the point you are making absolutely, but the math will need a second read. Thanks Riggery
Data, and especially data from the government-Pharma consortium, is the grease being applied to the tracks they've built on the slippery slope of corporate fascism.
Thankfully, some of us saw the sign along the way that read,
"Danger - Bridge Out Ahead",
and jumped off before the edge of the ravine.
Thank you for showing your work.